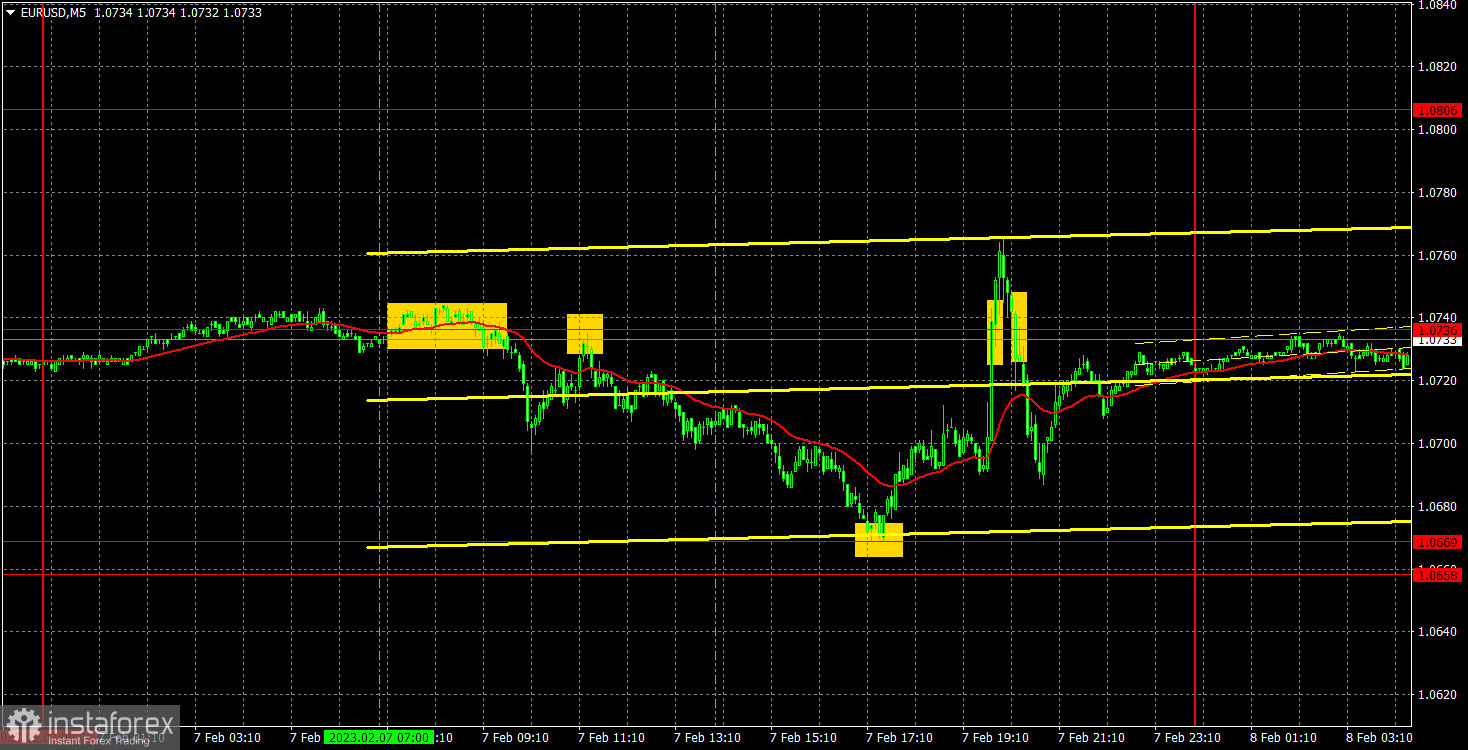
M5 chart of EUR/USD
On Tuesday, EUR/USD was bearish for most of the day. The decline was systematic and slow, which is not surprising since the market has already recovered from last week's events. However, when Federal Reserve Chairman Jerome Powell started his speech at the economic forum in Washington, the market reacted rather wildly. In fact, Powell said nothing new. He only reiterated that it could take a long time for inflation to return to 2%. He also repeated his earlier rhetoric that the Fed rate would continue to rise and that the "period of high rates" would take long. So we did not hear anything new, but the pair reacted with a 100 pip growth and suddenly a 100 pip drop. I believe that the correction against the four-day decline started, and Powell's speech was just the catalyst. Generally speaking, Powell's stance remains hawkish, so it would be logical to see a new strengthening of the dollar.
As for trading signals, at the European trading session, the pair rebounded twice from 1.0736, afterwards it fell to 1.0669. Traders could earn about 40 pips on this deal. You could have opened two deals, but the first one closed at Stop Loss breakeven. The rebound from 1.0669 could also be priced, and no matter when you closed the position, there was still a profit of at least 30 pips.
COT report
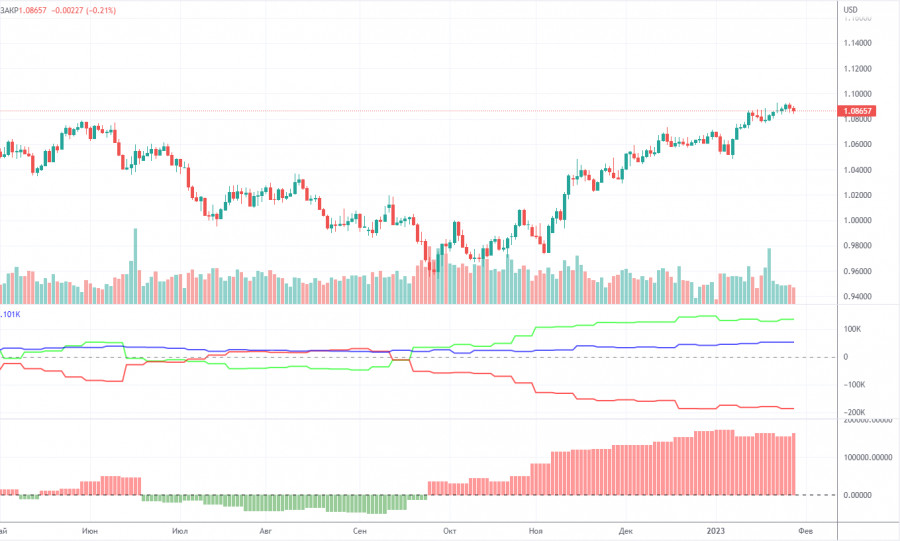
The COT reports on EUR/USD have been in line with expectations in recent months. The net non-commercial position has been on the rise since September. The bullish non-commercial position rises with each new week. Taking into account this fact, we may assume that the uptrend will soon come to an end. The red and green lines of the first indicator are far apart, which is usually a sign of the end of a trend. In the reporting week, non-commercial traders opened 9,500 long positions and 2,000 short ones. The net non-commercial position grew by 7,500. The number of long positions exceeds that of short ones by 134,000. It now remains to be seen how long large traders will be bullish. From the technical point of view, a bearish correction should have already occurred. Traders will unlikely stay bullish for another 2 or 3 months. Even the net non-commercial position shows that it is time for a correction. In total, there are 52,000 more long positions now among all groups of traders (732,000 vs 680,000).
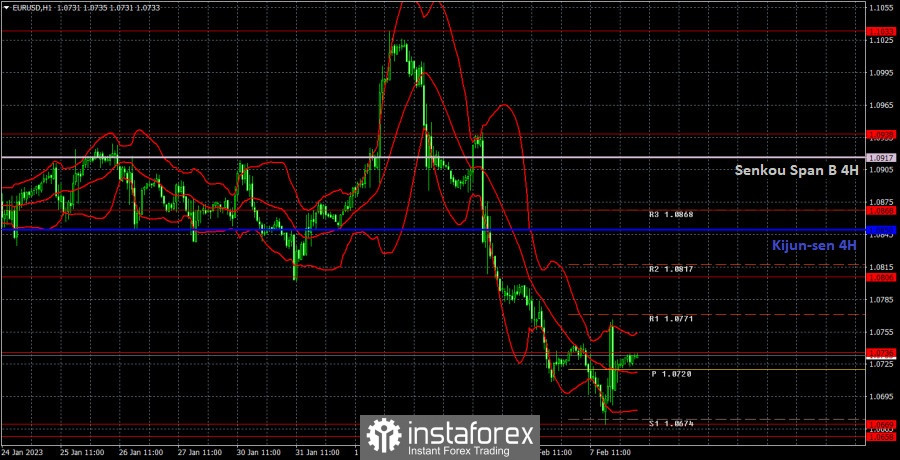
H1 chart of EUR/USD

On the one-hour chart, EUR/USD continues to fall sharply. I already warned you that the first days of the week could be moved by momentum, and yesterday the market showed that it is ready to start a bit of a bullish correction. So we might see an uptrend before the end of the week. Macroeconomics and fundamentals are still scarce. On Wednesday, important levels are seen at: 1.0485, 1.0581, 1.0658-1.0669, 1.0736, 1.0806, 1.0868, 1.0938, and also Senkou Span B lines (1.0917) and Kijun Sen (1.0850). Lines of the Ichimoku indicator may move during the day, which should be taken into account when determining trading signals. There are also support and resistance levels, but signals are not formed near these levels. Bounces and breakouts of the extreme levels and lines could act as signals. Don't forget about stop-loss orders, if the price covers 15 pips in the right direction. This will prevent you from losses in case of a false signal. On February 8, there are no important events in the EU and the US. The Fed will have a new batch of speeches and the stance is unlikely to differ from what Powell said. We reiterate: the market clearly understands what to expect from the Fed in the coming months.
What we see on the trading charts:
Price levels of support and resistance are thick red lines, near which the movement may end. They do not provide trading signals.
The Kijun-sen and Senkou Span B lines are the lines of the Ichimoku indicator, moved to the one-hour chart from the 4-hour one. They are strong lines.
Extreme levels are thin red lines from which the price bounced earlier. They provide trading signals.
Yellow lines are trend lines, trend channels, and any other technical patterns.
Indicator 1 on the COT charts reflects the net position size of each category of traders.
Indicator 2 on the COT charts reflects the net position size for the non-commercial group.