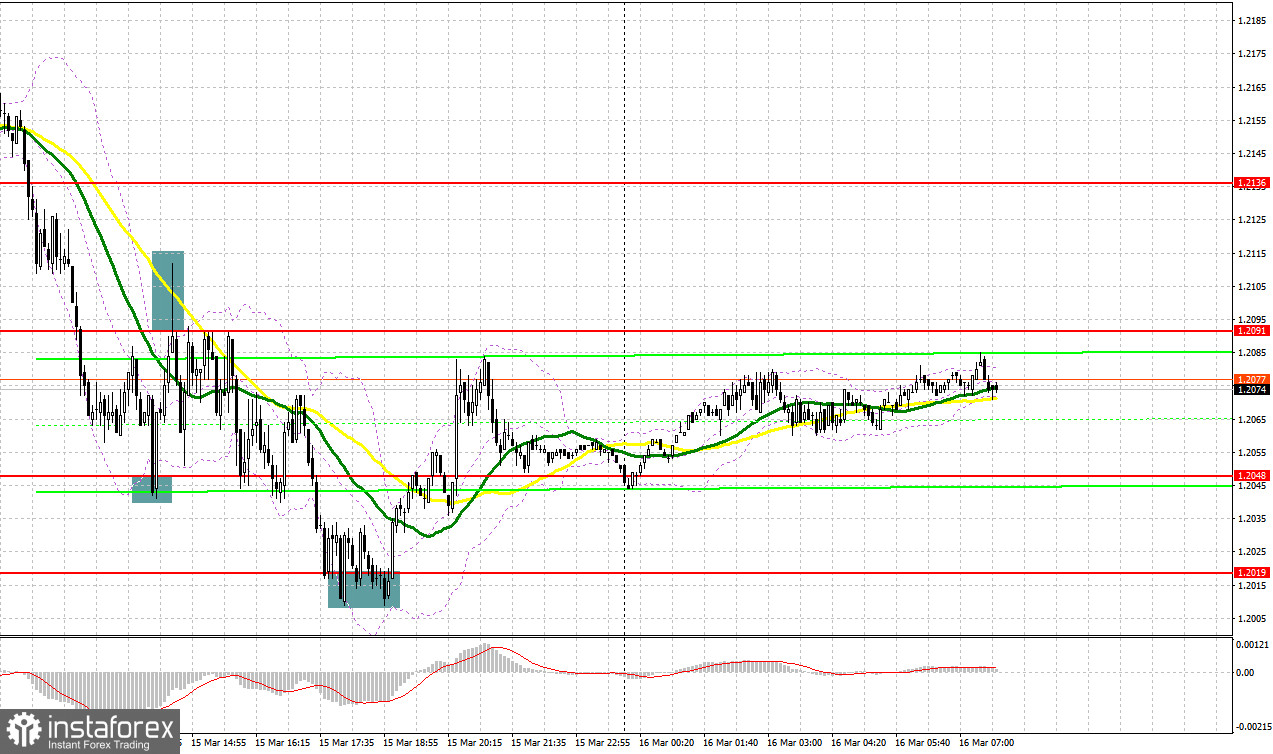
Yesterday, traders received several signals to enter the market. Let us take a look at the 5-minute chart to figure out what happened. Earlier, I asked you to pay attention to the level of 1.2136 to decide when to enter the market. Due to low market volatility before the publication of the British budget, I failed to reach the levels I mentioned. The fall and false breakout near the support at 1.2048 in the second part of the day gave a buy signal. The growth was more than 40 pips, but the resistance at 1.2091 remained unchanged. The fact that the pair did not settle at this level led to a sell signal, further along the trend, the pound fell to 1.2019, which made it possible for us to gain about 60 pips of profit. A false breakout at this level led to buying and correction by 30 pips.
Conditions for opening long positions on GBP/USD:
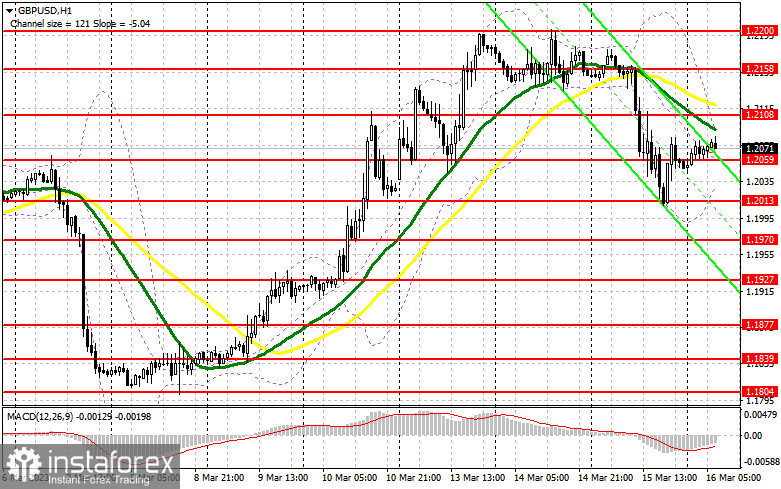
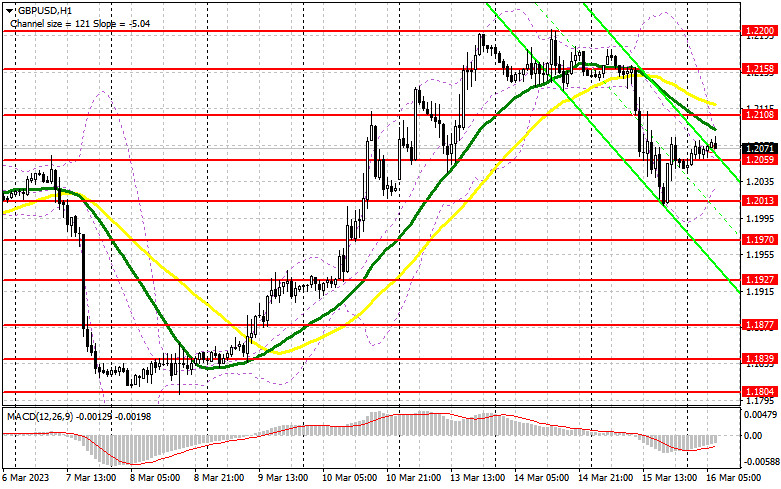
Chancellor of the Exchequer Jeremy Hunt's unconvincing speech and his sweet promises to return inflation to the target level by the end of this year did not convince the bulls, which resulted in the pound's fall - especially considering how quickly the problems of the US banking sector were transferred to the EU. Although, to be fair, we should say that Swiss Credit Suisse has been on its knees for a long time and we are not going to "make a mountain out of a molehill" just because the Saudis refused further financing of this bank. Today there is nothing at all for the pound, so the bulls have a chance to regain control of the levels they had at the beginning of the week. In case the pair falls, the bulls will count on the nearest support level at 1.2059. But only a false breakout of this level will give a buy signal in order for the pair to go back to 1.2108, as moving averages benefiting the bears are in this area. After consolidation and a downside test of this range and a bearish stop loss, the price may head towards 1.2158, where the bulls will face more serious problems. Traders may go long after a breakout, and this will allow the pound to climb to 1.2200, where it is better to lock in profits. If the pair falls and bulls fail to protect 1.2059, the pressure on the pound will come back quite strong, which will increase the risk of the pair's further decline. In the event of this, it is better to avoid buying the asset until the price is near the next support at 1.2013. There, traders may go long only after a false breakout. Likewise, GBP/USD could be bought on a bounce off the 1.1970 low, allowing a correction of 30 to 35 pips intraday.
Conditions for opening short positions on GBP/USD:
The bears still have a chance to build the bearish market further, especially after the turmoil in the banking sector, which may force the Bank of England to also consider the possibility of a softer interest rate hike at the next meeting. The trading plan in the European session will be to sell GBP/USD after a false breakout around the nearest resistance at 1.2108, which was formed yesterday. After that a sell signal will be made and the quotes may fall to the 1.2059 intermediate support that was formed today. After a breakout and an upward test, pressure on the pair will increase, this will give a sell signal with 1.2013 as the target. The next target is the 1.1970 low, where I will take profit. If the pound/dollar pair increases and bears fail to protect 1.2108, the bears will leave the market. A false breakout through the next resistance at 1.2158 will create a sell entry point. If there is no trading activity there as well, I am going to sell GBP/USD from the 1.2200 high, allowing a bearish correction of 30 to 35 pips intraday.
COT report:
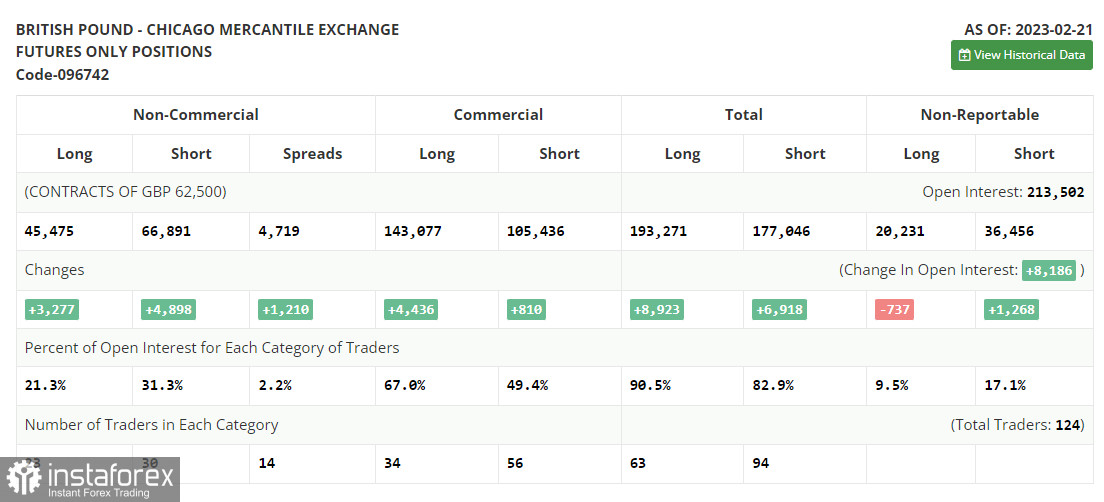
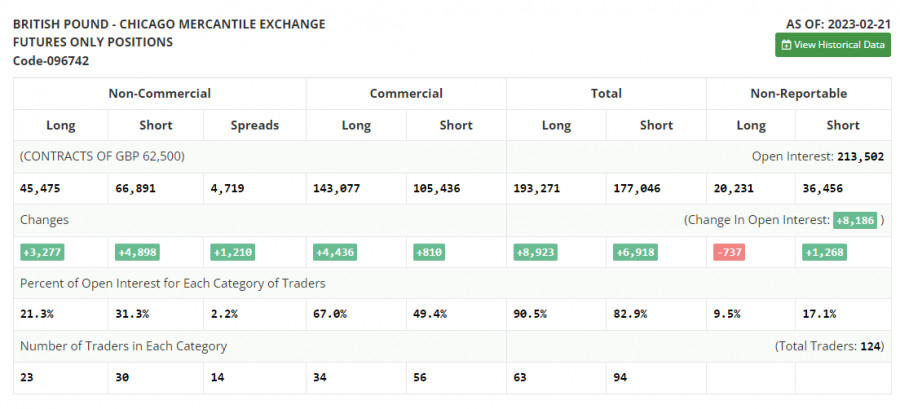
According to the COT report from February 21, the number of both long and short positions increased. Notably, the data is of zero importance at the moment since it was relevant a month ago. The CFTC has just started recovering after a cyber attack. That is why it is better to wait for fresh statistics. This week, all eyes will be turned to the UK labor market reports and average earnings growth. This will help the BoE to decide on the key interest rate hike amid stable inflation. Household earnings growth may keep inflation at the current high level. Meanwhile, the US is going to disclose its inflation figures, which may prove that Jerome Powell will switch to a looser policy. A risk of the US banking sector collapse, which occurred after the BSV bankruptcy, may force the Fed to alter its view on how long it should raise the benchmark rate until the economy becomes damaged. The recent COT report unveiled that the number of short non-commercial positions increased by 3,277 to 45,475, while the number of long non-commercial positions jumped by 4,898 to 66,891. Against the backdrop, the negative value of the non-commercial net position advance to -21,416 against -19,795 a week earlier. The weekly closing price decreased to 1.2112 from 1.2181.
Signals of indicators:
Moving Averages
Trading is performed below the 30- and 50-day moving averages, indicating a change in market sentiment.
Note: The author considers the period and prices of moving averages on the one-hour chart which differs from the general definition of the classic daily moving averages on the daily chart.
Bollinger Bands
In case of a decline, the lower limit of the indicator located around 1.2036 will act as support.
Description of indicators
- Moving average (a moving average determines the current trend by smoothing volatility and noise). The period is 50. It is marked in yellow on the chart.
- Moving average (a moving average determines the current trend by smoothing volatility and noise). The period is 30. It is marked in green on the graph.
- MACD indicator (Moving Average Convergence/Divergence - convergence/divergence of moving averages). A fast EMA period is 12. A slow EMA period is 26. The SMA period is 9.
- Bollinger Bands. The period is 20.
- Non-profit speculative traders are individual traders, hedge funds, and large institutions that use the futures market for speculative purposes and meet certain requirements.
- Long non-commercial positions are the total number of long positions opened by non-commercial traders.
- Short non-commercial positions are the total number of short positions opened by non-commercial traders.
- The total non-commercial net position is a difference in the number of short and long positions opened by non-commercial traders.