Details of the economic calendar on March 15
Eurostat data show an increase in industrial production in the EU in January by 0.7% compared to December last year. At the same time, relative to January 2022, production increased by 0.9%. However, the data for December was revised for the worse.
In February, U.S. retail sales fell 0.4% from the previous month, according to the Commerce Department. Note that economists predicted a decline of 0.3%.
The Producer Price Index (PPI) in the U.S. in February decreased by 0.1% month-on-month and increased by 4.6% year-on-year, according to the Department of Labor. On average, economists expected inflation at the production level of 0.3% MoM and 5.4% YoY. The core index was estimated at 0.4% MoM and 5.2% YoY.
Despite the aforementioned statistics, traders' attention has been focused on problems at banking giant Credit Suisse, fueling fears of a global financial crisis. The bank informed investors of its inability to provide additional financial support. As a result, Credit Suisse shares plunged to record lows, pushing the broad European banking index to its lowest level since early January and triggering a sell-off in currency markets.
Analysis of trading charts from March 15
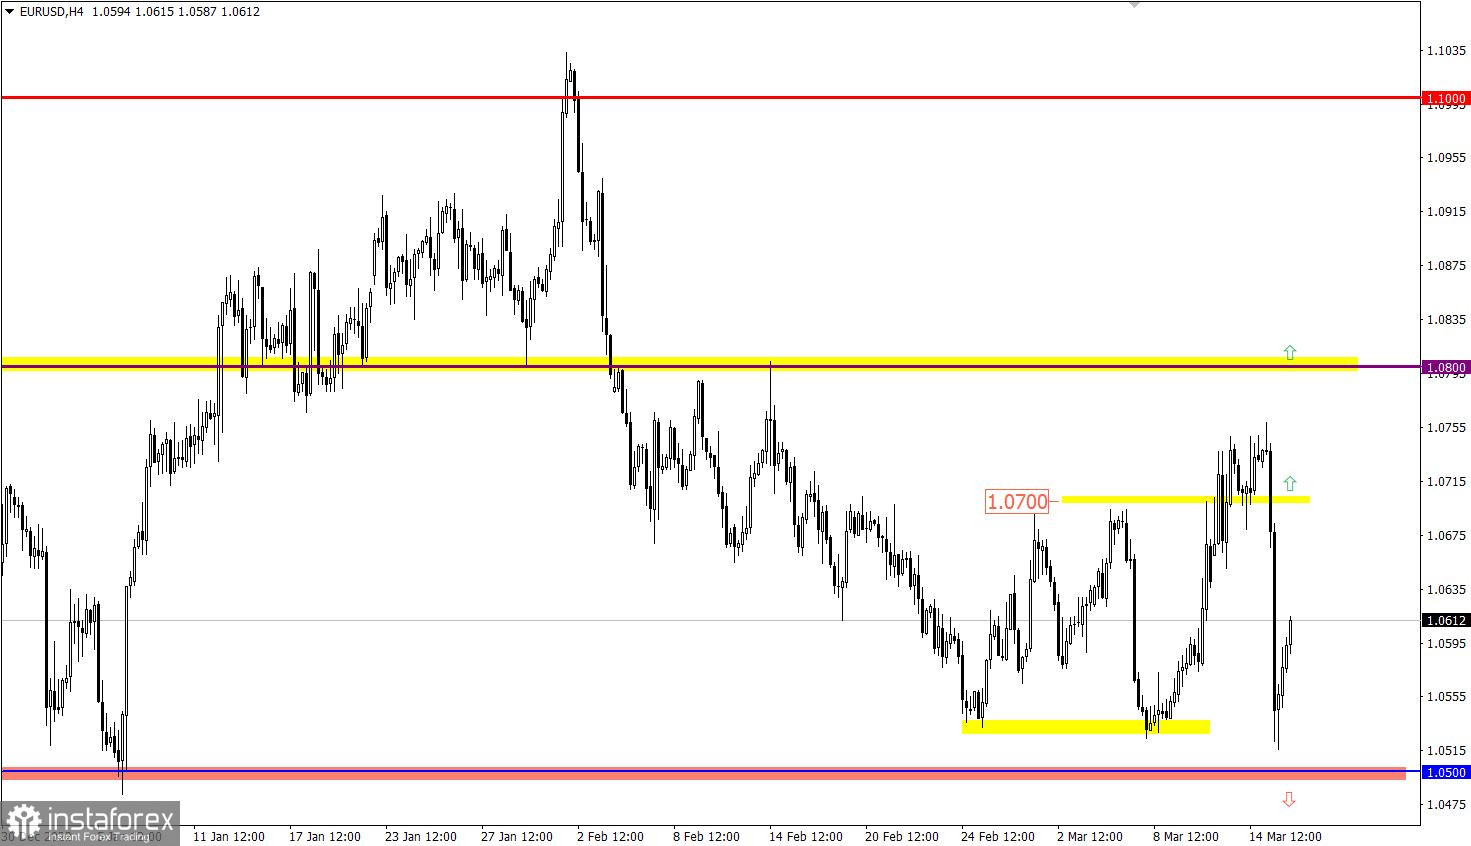
EUR/USD fell over 200 pips in just a few hours. Such a movement led to an inertial move, allowing the quotes to update the local low of the downward cycle. The 1.0500 support level appeared on the path of speculators, relative to which there was a technical pullback.
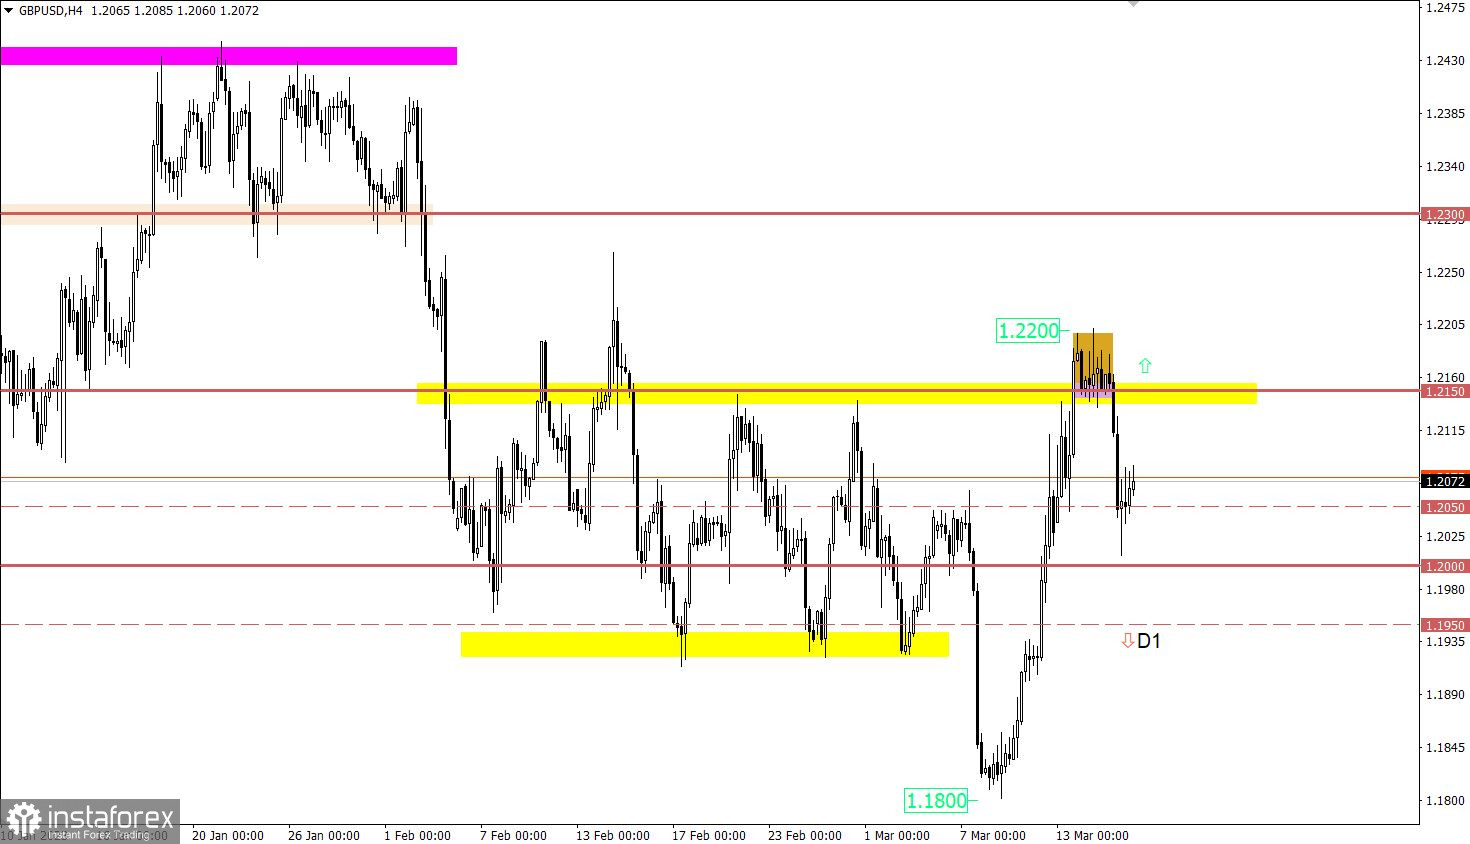
GBP/USD returned to the 1.2000 psychological level during the inertial downward movement, where it reduced the volume of short positions. This movement was triggered by the EUR/USD pair, which lost 200 pips in the same time period. As a result, through a positive correlation, it pulled the pound sterling along with it.
Economic calendar for March 16
Today the focus will be on the results of the European Central Bank (ECB) meeting, where further interest rate hikes are expected. However, given the current turmoil in the banking sector, experts are revising their forecasts on the ECB rhetoric. They see a possible softening of the regulator's position, which can lead to a 25 basis points rate hike instead of the previously assumed 50 basis points.
In a recent statement, Barclays, one of the largest banks in the UK and the world, stated that the ECB is likely to raise rates by 25 bps on Thursday, not 50 bps or no hike.
Time targeting:
ECB meeting result – 13:15 UTC
ECB press conference – 13:45 UTC
EUR/USD trading plan for March 16
In this situation, the pullback is associated with the oversold status of the euro, and it may persist in the market, partially restoring quotes. Subsequent speculative jumps are expected during the announcement of the ECB meeting results.
If the regulator's rhetoric points to monetary policy easing, this will lead to a sell-off of the euro and, possibly, an update of the local low of the downward cycle.
If the ECB does not provide clear guidance on its next steps and the key rate is raised by 50 basis points, it could further strengthen the euro's value.
GBP/USD trading plan for March 16
It can be assumed that the upward trend still persists in the market. In theory, the price rebound from the psychological level can contribute to the restoration of long positions in the pound sterling. The main technical signal of growth will appear only after the price returns above the level of 1.2150.
A downside scenario will be considered by market participants if the price holds below 1.1950 throughout the day. In this case, the probability of updating the local low of the downward cycle increases.
What's on the charts
The candlestick chart type is white and black graphic rectangles with lines above and below. With a detailed analysis of each individual candle, you can see its characteristics relative to a particular time frame: opening price, closing price, intraday high and low.
Horizontal levels are price coordinates, relative to which a price may stop or reverse its trajectory. In the market, these levels are called support and resistance.
Circles and rectangles are highlighted examples where the price reversed in history. This color highlighting indicates horizontal lines that may put pressure on the asset's price in the future.
The up/down arrows are landmarks of the possible price direction in the future.