Analyzing Friday's trades:
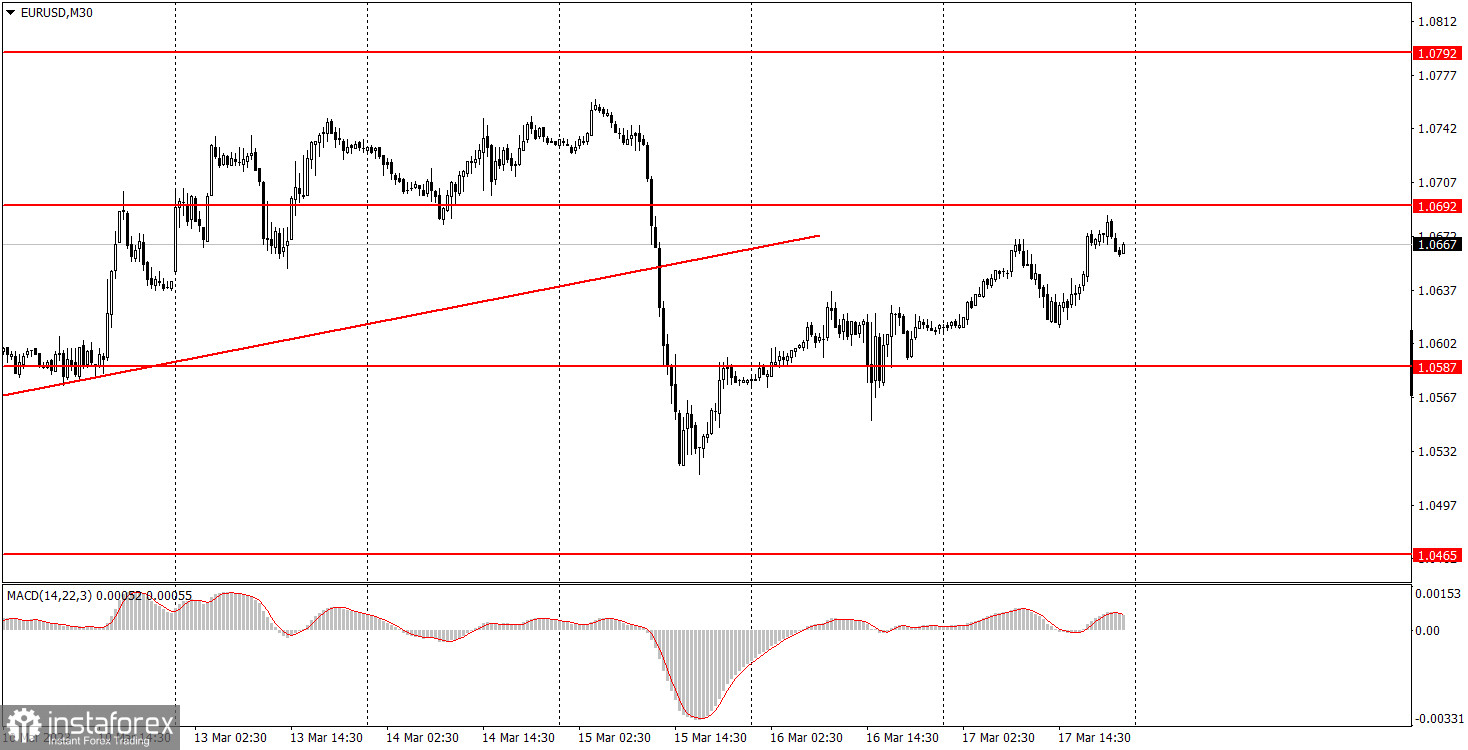
EUR/USD on 30M chart
On Friday, EUR/USD gradually rose. Despite the fact that last week, the pair broke through another short-term trend line, the fall did not last long. And it is hardly possible to say that the macroeconomic or fundamental background is to blame for it. The European Central Bank meeting was held on Thursday and its results can hardly be called unequivocally bullish or bearish for the euro. The European Union released an important inflation report, but its value coincided with forecasts, so the reaction was weak. In general, the pair is still in the "swing" or flat mode on the higher charts. Therefore, the movements are completely random now with rare exceptions. The pair is currently rising, and it may fall for no reason. Thus, in the current circumstances, it is difficult to make any predictions. Anyway, there will be some important events in the coming week, so we hope that the trend will recover. There's no sense to look at the US macro data since it was not very important. The reports were weak but the reaction to it was weak as well.
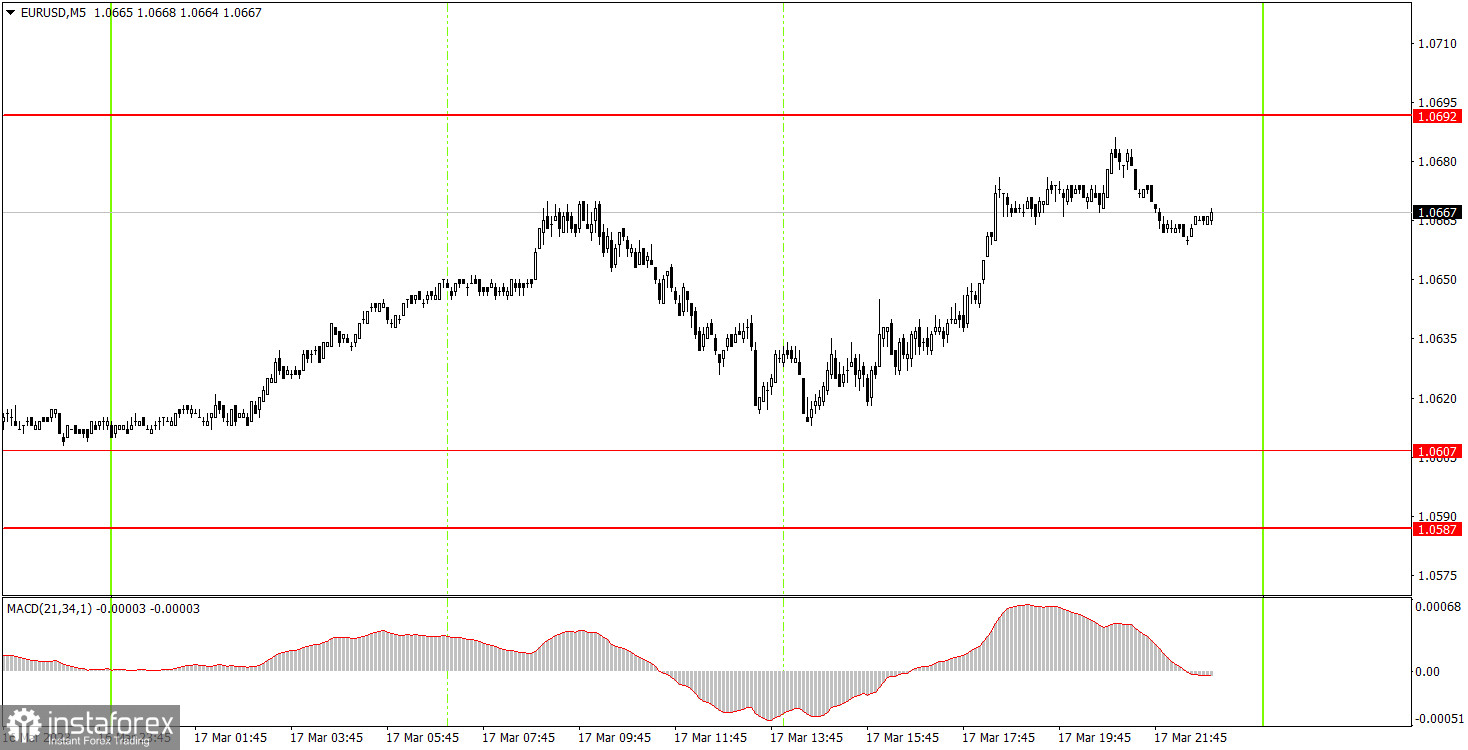
EUR/USD on 5M chart
On the 5-minute chart, you can clearly see what the movement was like on Friday. The EU inflation report provoked a slight fall in the euro, and the US report pushed the dollar to edge down. During the day, the pair never reached any of the levels I mentioned so there was no signal. The movements were not the worst, it was possible to earn on them, but in a single moment the price failed to reach 1.0607 by only 6 points. Therefore, if you followed our recommendations, you shouldn't have opened positions.
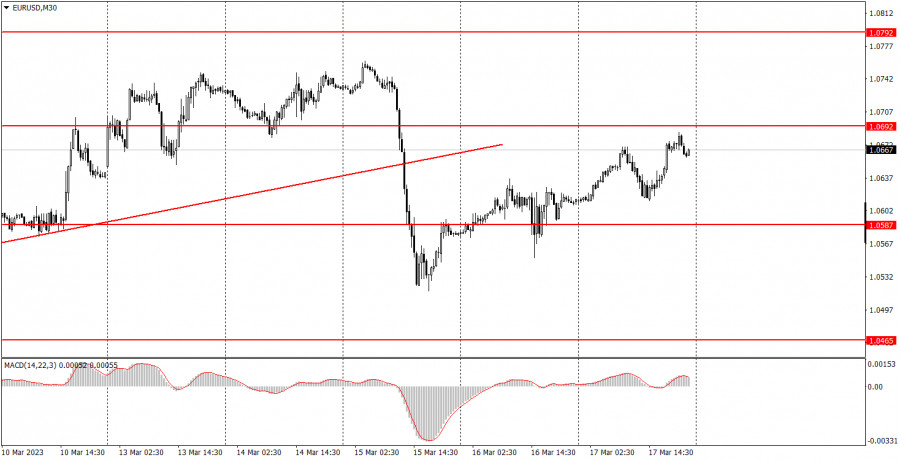
Trading tips on Monday:
On the 30-minute chart, the pair quickly finished forming an uptrend, rolled back down and started a new one. Given the state of the "swing", the pair can move in any direction, regardless of the macroeconomic background. The outcome of the ECB meeting had little effect on traders' sentiment. On the 5-minute chart, it is recommended to trade at the levels 1.0391, 1.0433, 1.0465-1.0483, 1.0535, 1.0587-1.0607, 1.0692, 1.0737, 1.0792, 1.0857-1.0867. As soon as the price passes 15 pips in the right direction, you should set a Stop Loss to breakeven. On Monday, there will be two speeches by ECB President Christine Lagarde in the European Union. She can tell the market important things regarding the monetary policy and after the latest inflation report it will even be quite logical and expected. So "boring Monday" might actually not be boring at all. There is no important data planned in the US.
Basic rules of the trading system:
1) The strength of the signal is determined by the time it took the signal to form (a rebound or a breakout of the level). The quicker it is formed, the stronger the signal is.
2) If two or more positions were opened near a certain level based on a false signal (which did not trigger a Take Profit or test the nearest target level), then all subsequent signals at this level should be ignored.
3) When trading flat, a pair can form multiple false signals or not form them at all. In any case, it is better to stop trading at the first sign of a flat movement.
4) Trades should be opened in the period between the start of the European session and the middle of the US trading hours when all positions must be closed manually.
5) You can trade using signals from the MACD indicator on the 30-minute time frame only amid strong volatility and a clear trend that should be confirmed by a trendline or a trend channel.
6) If two levels are located too close to each other (from 5 to 15 pips), they should be considered support and resistance levels.
On the chart:
Support and Resistance levels are the levels that serve as targets when buying or selling the pair. You can place Take Profit near these levels.
Red lines are channels or trend lines that display the current trend and show in which direction it is better to trade now.
The MACD indicator (14, 22, and 3) consists of a histogram and a signal line. When they cross, this is a signal to enter the market. It is recommended to use this indicator in combination with trend patterns (channels and trendlines).
Important announcements and economic reports that can be found on the economic calendar can seriously influence the trajectory of a currency pair. Therefore, at the time of their release, we recommend trading as carefully as possible or exiting the market in order to avoid sharp price fluctuations.
Beginners on Forex should remember that not every single trade has to be profitable. The development of a clear strategy and money management is the key to success in trading over a long period of time.