empty
 
 
24.03.2023 10:08 AM
Technical analysis of EUR/USD and GBP/USD on March 24

EUR/USD

This image is no longer relevant

Larger timeframes

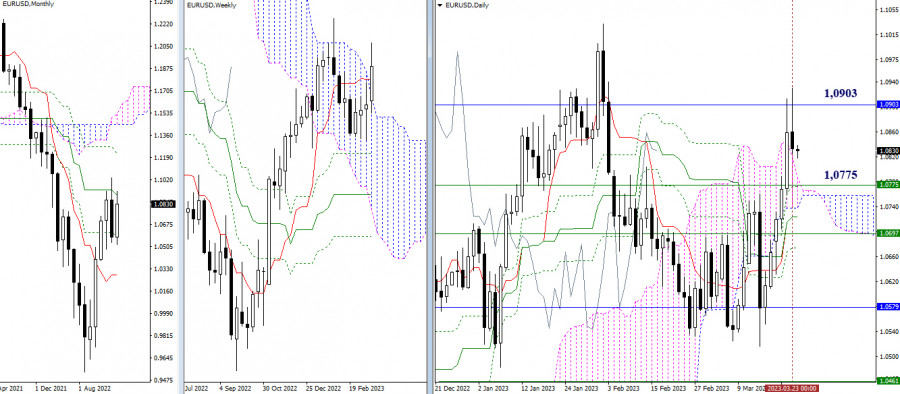
The one-month resistance of 1.0903 was tested yesterday. However, the test result was not in the bulls' favor. Eventually, EUR/USD retreated back to support of the intraday cloud. Therefore, the upward targets of 1.9003 (one-month medium-term trendline) and 1.1033 (a one-year high) remain valid today provided that the bulls assert themselves. The bears' task in this section will be complicated by a vast support zone consisting mainly of daily levels 1.0787 – 1.0772 – 1.0738 – 1.0724 – 1.0675. This support zone is also reinforced by weekly support levels: 1.0775 (short-term trend) and 1.0697 (the upper border of the Ichimoku cloud).

This image is no longer relevant

H4 – H1

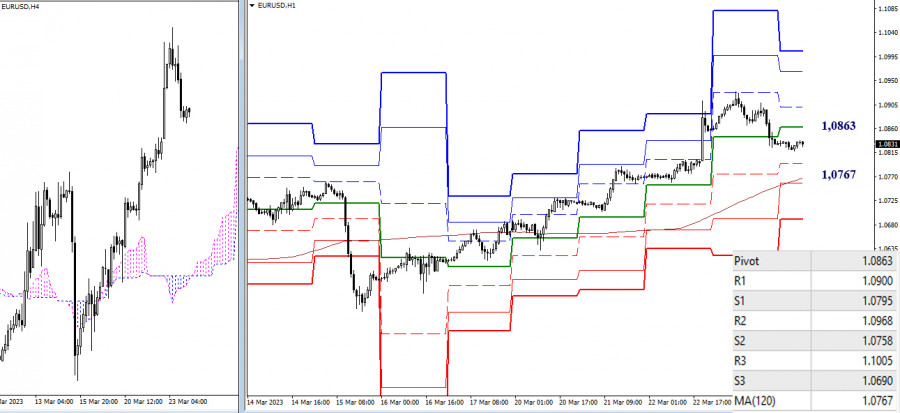
On smaller timeframes, the instrument is going through a correctional decline. A weekly long-term trendline (1.0767) acts as the key support responsible for the current balance of trading forces. If the price settles below, the bears will gain an advantage on smaller timeframes. However, to change the situation on larger timeframes, the instrument will have to surpass a wide zone of intraday and weekly levels. If the bulls can benefit from support levels, rekindle price growth, and enhance the bullish sentiment, we can determine the following intraday target levels: 1.0863 – 1.0900 – 1.0968 – 1.1005 (all of them are classical pivot levels).

***

GBP/USD

This image is no longer relevant

Larger timeframes

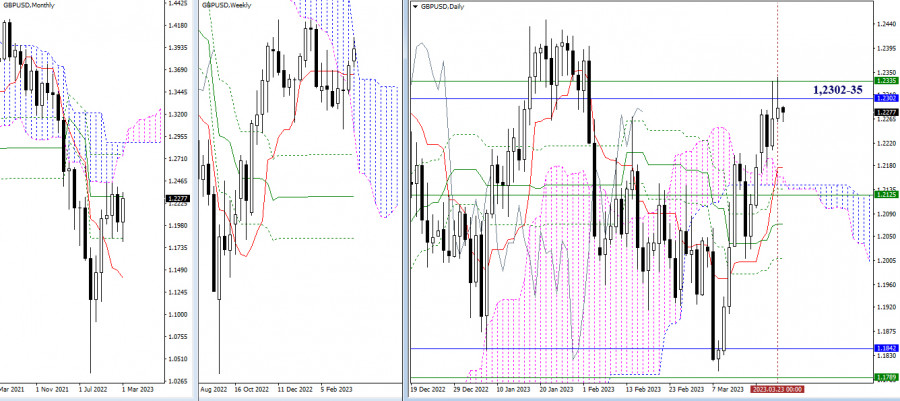
The pound bulls again failed to surpass resistance at 1.2302-35 (a one-month medium-term trend + the upper border of the weekly cloud). As a result, the upward targets at 1.2302-35 and 1.2447 (a one-year high) are still valid under the current market conditions. If the area of 1.2302-35 is tested which will end up with a drop and the bears strive to affirm their leadership, the nearest support zone is defined between 1.2176 and 1.2125 which combines the levels of various timeframes.

This image is no longer relevant

H4 – H1

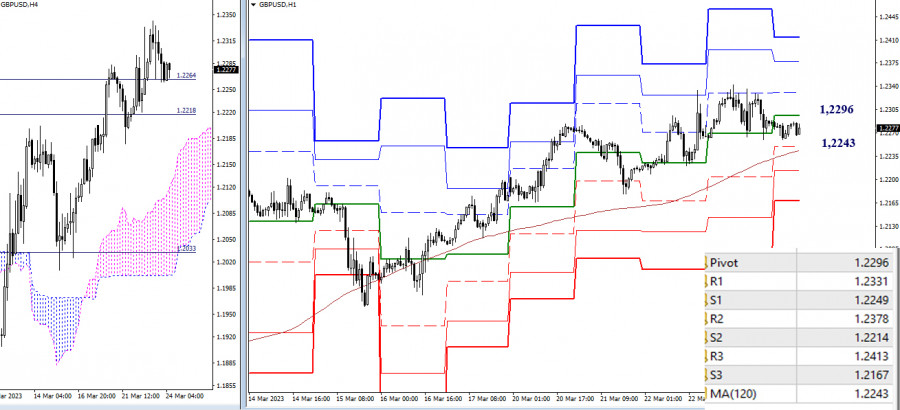
On smaller timeframes, the bears are about to test the weekly long-term trendline of 1.2243. A breakout and a trend reversal could change the current balance of trading forces in favor of the bears. If so, the next downward intraday targets will be seen as classic pivot levels: 1.2214 (S2) and 1.2167 (S3). If the bulls recapture the central pivot intraday level of 1.2296 and manage to update yesterday's high of 1.2342, they will revive the upward move on smaller timeframes. To enable a further climb, it is important to overcome classic pivot levels of 1.2378 (R2) and 1.2413 (R3).

***

This technical analysis is based on the following ideas:

Larger timeframes - Ichimoku Kinko Hyo (9.26.52) + Fibo Kijun levels

Smaller timeframes - H1 – classic pivot points + 120-period Moving Average (weekly long-term trend line)

Evangelos Poulakis,
Analytical expert of InstaForex
© 2007-2024
通过InstaForex赚取加密货币汇率变动的收益。
下载MetaTrader 4并开启您的第一笔交易。
  • Grand Choice
    Contest by
    InstaForex
    InstaForex always strives to help you
    fulfill your biggest dreams.
    JOIN CONTEST
  • Chancy Deposit
    Deposit your account with $3,000 and get $8000 more!
    In March we raffle $8000 within the Chancy Deposit campaign!
    Get a chance to win by depositing $3,000 to a trading account. Having fulfilled this condition, you become a campaign participant.
    JOIN CONTEST
  • Trade Wise, Win Device
    Top up your account with at least $500, sign up for the contest, and get a chance to win mobile devices.
    JOIN CONTEST
  • 100% Bonus
    Your unique opportunity to get a 100% bonus on your deposit
    GET BONUS
  • 55% Bonus
    Apply for a 55% bonus on your every deposit
    GET BONUS
  • 30% Bonus
    Receive a 30% bonus every time you top up your account
    GET BONUS

推荐文章

现在无法通话?
提出您的问题,用 在线帮助.
Widget callback