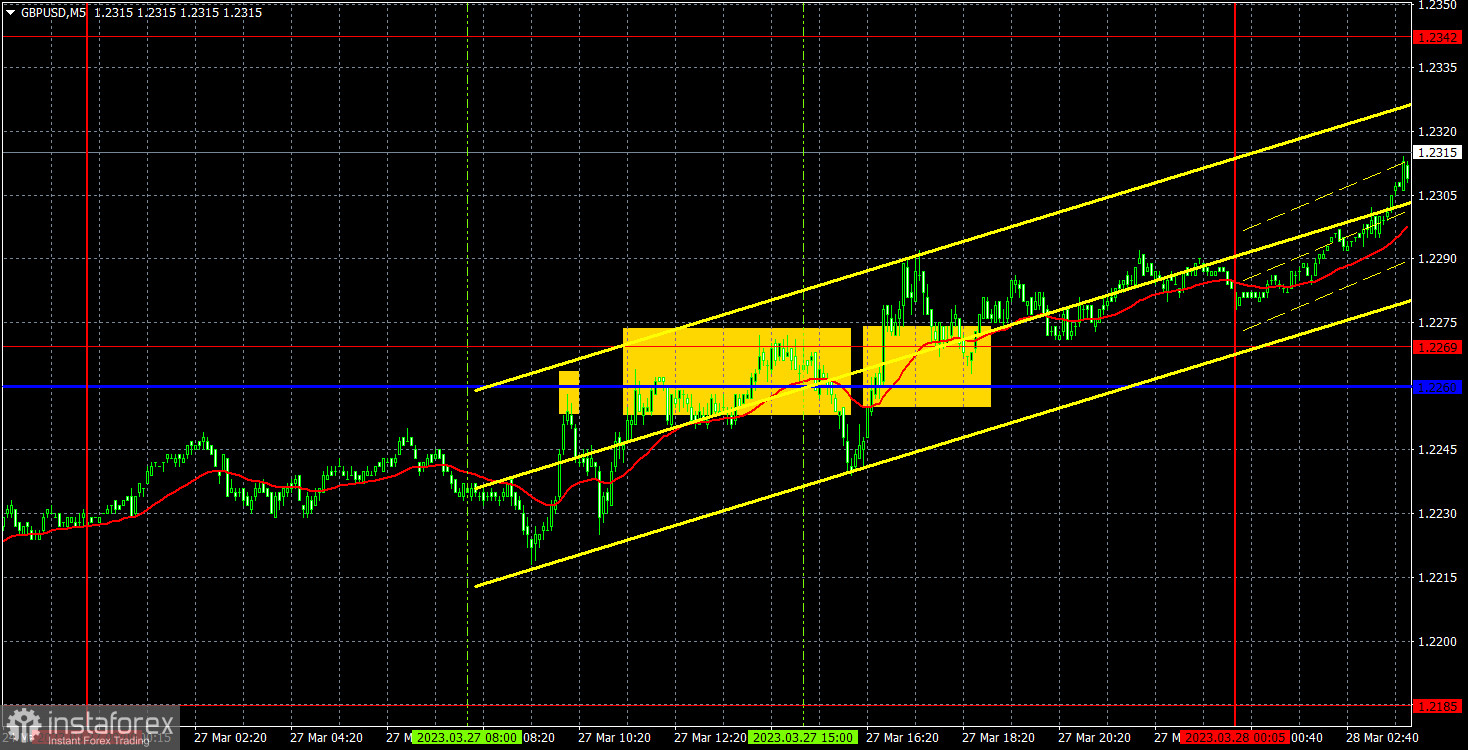
5M chart of GBP/USD
On Monday, GBP/USD also moved with an upward bias, but at the same time, it constantly reversed and rolled back down throughout the day. As a result, we got something like a "swing". And "swings" are always bad for traders. Let's pay attention to the fact that the pound found a reason to rise on Monday even when there were almost no important events. Bank of England Governor Andrew Bailey did give a speech but then he did not say anything that was relatively important. Nevertheless, the market is buying the British currency again, which is already perplexing. In our fundamental articles, we tried to figure out why the pound is rising because in general, the upward movement looks strange. Moreover, the price had consolidated under the ascending trend line just a few days ago, and before that it was in an uptrend for about three weeks, and it could not even enter a bearish correction. In general, the situation is as follows: no matter what happens, the pound is still going to rise.
The trading signals were very bad. The pair reached and overcame the 1.2260-1.2269 area several times, but none of the signals resulted in reaching the nearest target level. At least with the first sell signal, we could set the Stop Loss on Breakeven, as the price fell 20 points. The next signal was no longer there. And the third signal should not have been used at all since the first two signals were false. It wasn't a great day, let's just hope the next few days will be better.
COT report:
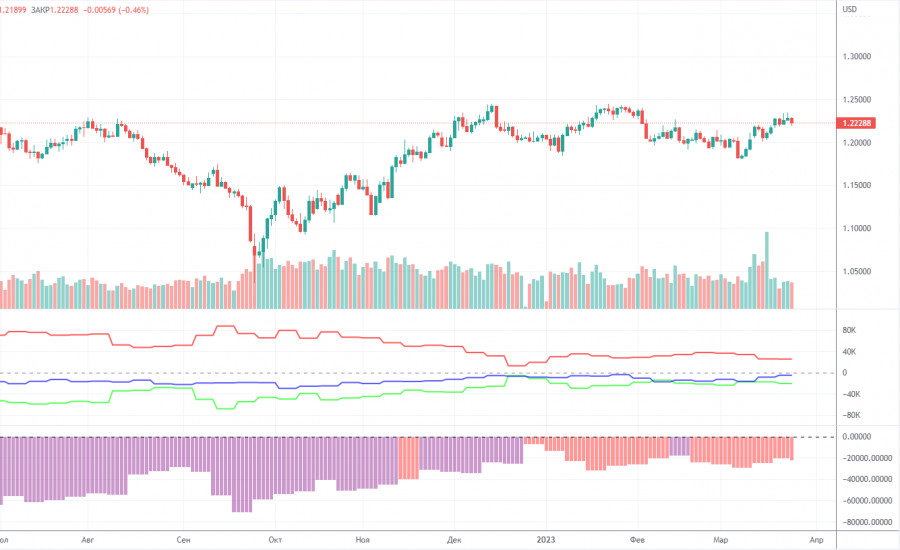
For the British pound, the Commodity Futures Trading Commission has caught up with the lost time and has now released reports exactly on time. The last report available is for March 21. According to that report, the non-commercial group closed 3,700 long positions and 500 short ones. Thus, the net position of non-commercial traders decreased by 3,200 but continues to grow. The net position indicator has been steadily growing over the past months but the mood of major traders still remains bearish. Although the pound sterling is growing against the dollar (in the medium term), it is very difficult to answer the question why it is doing this from a fundamental point of view. It is quite possible that the pound sterling may slump in the near future. Formally, it has already begun its downward movement but so far it looks more like a flat. Notably, both major pairs are moving similarly at the moment. However, the net position for the euro is positive and even implies the imminent completion of the upward momentum, whereas for the pound it is negative, which gives rise to expectations of further growth. But at the same time, the pound has already grown by 2100 points, which is a lot, and without a strong bearish correction the continuation of the growth will be absolutely illogical. The non-commercial group opened a total of 49,000 shorts and 28,000 longs. We remain skeptical about the long-term growth in the British currency and expect it to fall deeper.
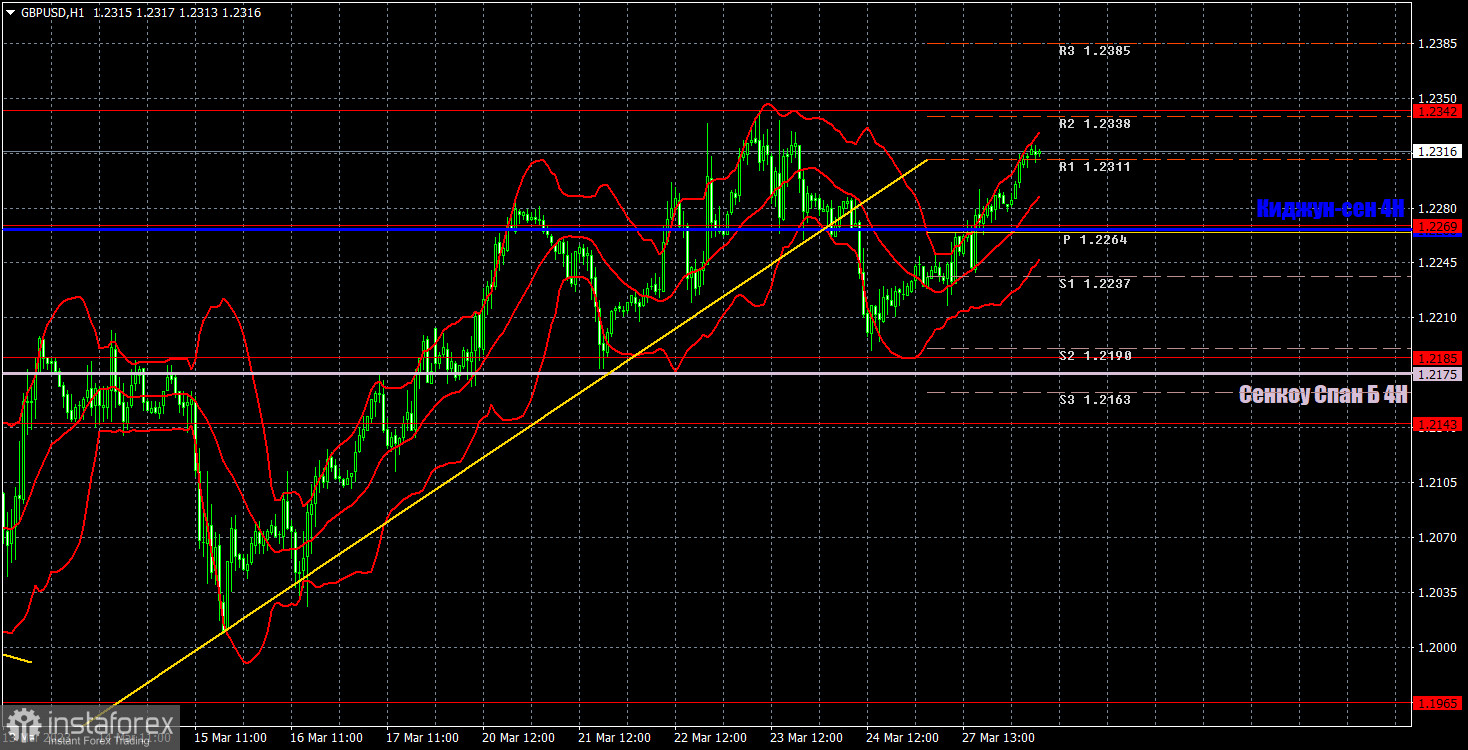
1H chart of GBP/USD
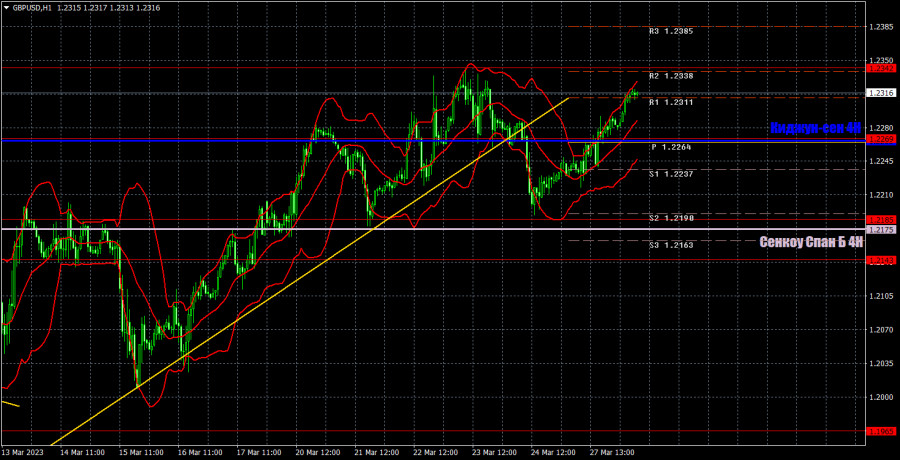
On the one-hour chart, GBP/USD has overcome the trend line, but it has already consolidated above the critical line and it seems that it is ready to resume the uptrend. Therefore, even a strong sell signal can't help pull down the pair just yet. The fact that there is no corresponding fundamental background does not prevent the pound from rising further. On March 28, it is recommended to trade at the key level of 1.1927, 1.1965, 1.2143, 1.2185, 1.2269, 1.2342, 1.2429-1.2458, 1.2589. The Senkou Span B (1.2175) and Kijun Sen (1.2266) lines can also generate signals. Rebounds and breakouts from these lines can also serve as trading signals. It is better to set the Stop Loss at breakeven as soon as the price moves by 20 pips in the right direction. The lines of the Ichimoku indicator can change their position throughout the day which is worth keeping in mind when looking for trading signals. On Tuesday, Bailey will deliver another speech, but most likely it will be the same as yesterday's. And right now the pound does not even need any support to rise even further.
Indicators on charts:
Resistance/support - thick red lines, near which the trend may stop. They do not make trading signals.
Kijun-sen and Senkou Span B are the Ichimoku indicator lines moved to the hourly timeframe from the 4-hour timeframe. They are also strong lines.
Extreme levels are thin red lines, from which the price used to bounce earlier. They can produce trading signals.
Yellow lines are trend lines, trend channels, and any other technical patterns.
Indicator 1 on the COT chart is the size of the net position of each trader category.
Indicator 2 on the COT chart is the size of the net position for the Non-commercial group of traders.