Analyzing Thursday's trades:
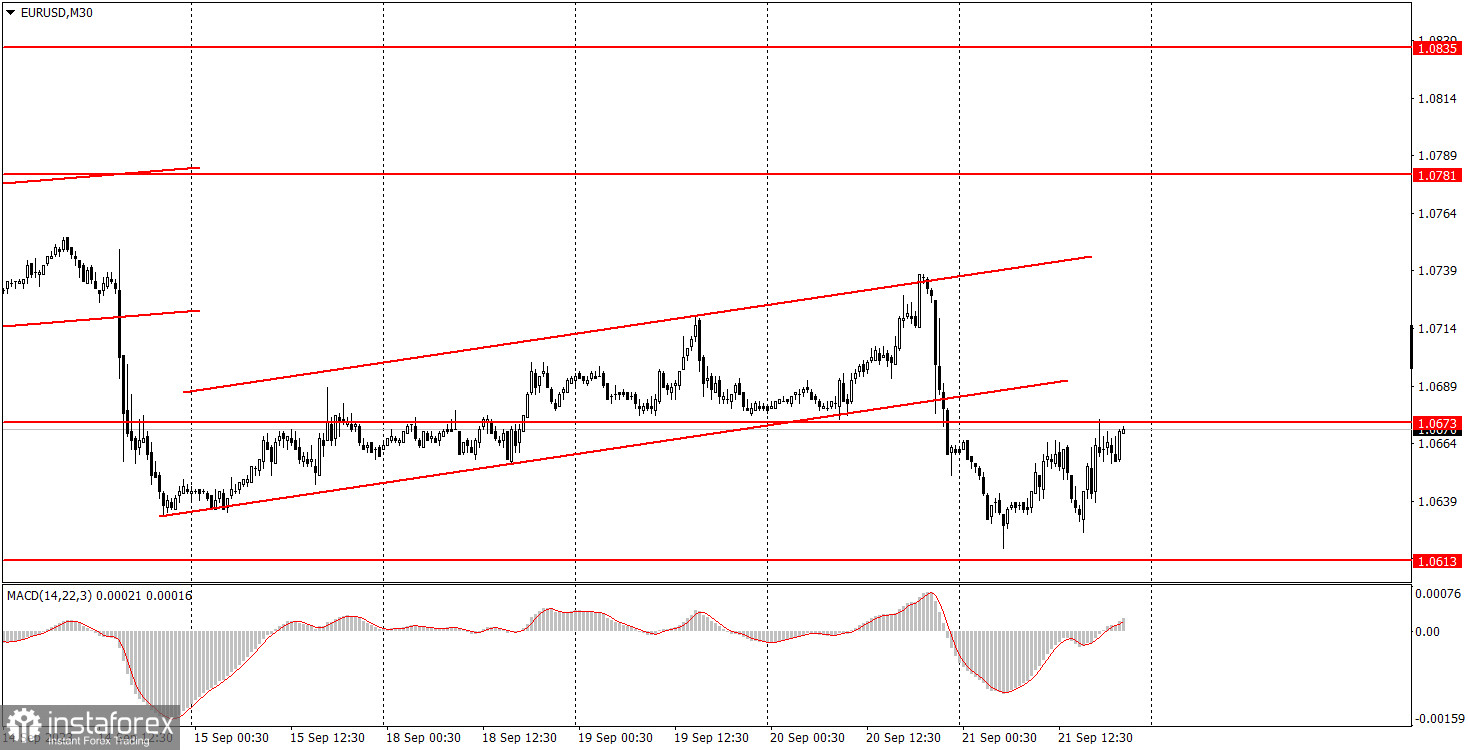
EUR/USD on 30M chart
EUR/USD tried to correct higher on Thursday. History repeats itself. A week earlier, after the European Central Bank meeting on Thursday, the pair plummeted following a week of sluggish growth. This week, we saw the same pattern, but the crash occurred on Wednesday after the Federal Reserve (FOMC) meeting. Although the U.S. central bank did not announce any decision that was notably hawkish, the dollar continued to strengthen. And the market remembered that there was no reason to buy the dollar on Wednesday.
Then the Bank of England announced the results of its meeting, and the pound bulls were disappointed, who were already few in the market. However, the pound, which could have pulled the euro down with it, did not do so this time, and the euro even managed to slightly recover during the day. Therefore, from our perspective, the movements on Wednesday evening and throughout Thursday were quite chaotic, and it's better not to try to find logic in them. There could be dozens of explanations for such movements. The fact is that the fundamental backdrop was strong, and such a backdrop provokes "emotional storms" in the market.
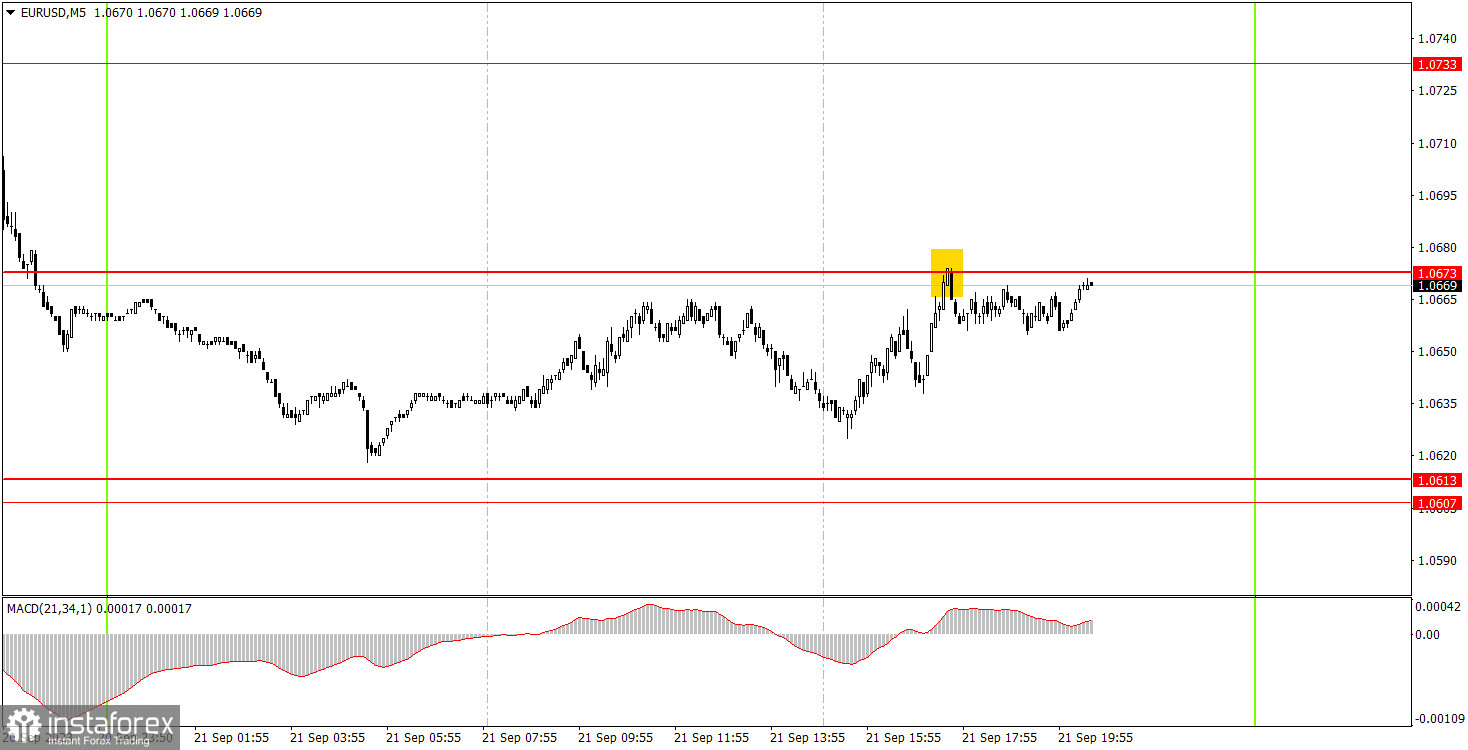
EUR/USD on 5M chart
On the 5-minute chart, the pair showed volatility of 55 pips. In other words, the holiday came to an end, and once again we're facing harsh weekdays with volatility that was impossible to trade. For example, on Thursday, the pair moved by around 55 pips from the low to the high of the day. Luckily, only one trading signal was formed, and given the strength of the movement, there's an 80% chance that any signal would turn out to be false and the pair would be unable to reach its target level. By the middle of the US session, the pair reached the level of 1.0673, and then... nothing happened.
Trading tips on Friday:
On the 30-minute chart, EURUSD started a weak correction. The euro still lacks robust bullish indicators. In the medium term, we anticipate the euro's further decline, but the pair could still correct higher since they are also necessary. The key levels on the 5M chart are 1.0517-1.0533, 1.0607-1.0613, 1.0673, 1.0733, 1.0767-1.0781, 1.0835, 1.0871, 1.0901-1.0904. A stop loss can be set at a breakeven point as soon as the price moves 15 pips in the right direction. On Friday, traders now look to the release of the German, American, and EU Manufacturing and Services PMIs for September. All nine indices may show a decline, but we can't be certain. Everything will depend on the actual values and how they align with the forecasts.
Basic trading rules:
1) The strength of the signal depends on the time period during which the signal was formed (a rebound or a break). The shorter this period, the stronger the signal.
2) If two or more trades were opened at some level following false signals, i.e. those signals that did not lead the price to Take Profit level or the nearest target levels, then any consequent signals near this level should be ignored.
3) During the flat trend, any currency pair may form a lot of false signals or do not produce any signals at all. In any case, the flat trend is not the best condition for trading.
4) Trades are opened in the time period between the beginning of the European session and until the middle of the American one when all deals should be closed manually.
5) We can pay attention to the MACD signals in the 30M time frame only if there is good volatility and a definite trend confirmed by a trend line or a trend channel.
6) If two key levels are too close to each other (about 5-15 pips), then this is a support or resistance area.
How to read charts:
Support and Resistance price levels can serve as targets when buying or selling. You can place Take Profit levels near them.
Red lines are channels or trend lines that display the current trend and show which direction is better to trade.
MACD indicator (14,22,3) is a histogram and a signal line showing when it is better to enter the market when they cross. This indicator is better to be used in combination with trend channels or trend lines.
Important speeches and reports that are always reflected in the economic calendars can greatly influence the movement of a currency pair. Therefore, during such events, it is recommended to trade as carefully as possible or exit the market in order to avoid a sharp price reversal against the previous movement.
Beginners should remember that every trade cannot be profitable. The development of a reliable strategy and money management are the key to success in trading over a long period of time.