Analyzing Friday's trades:
EUR/USD on 30M chart
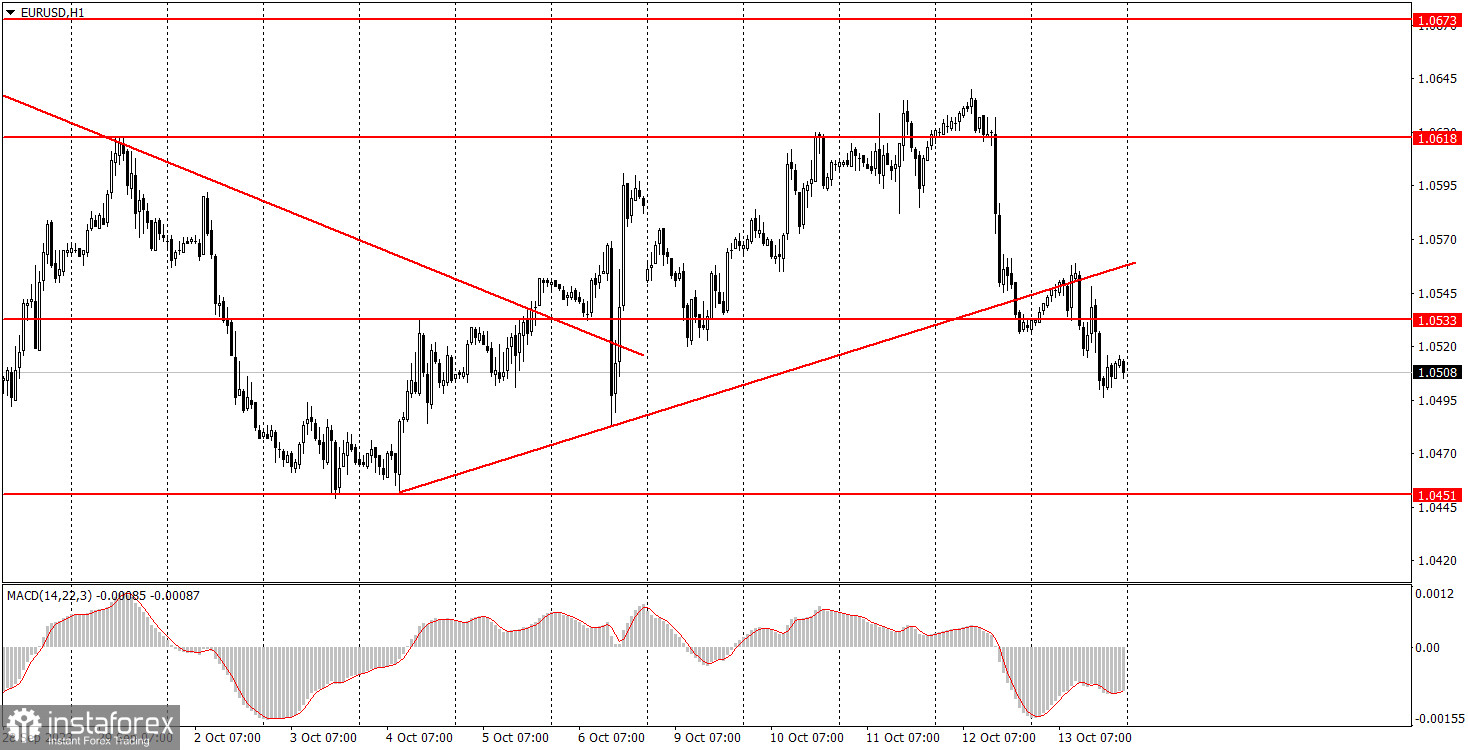
On Friday, the EUR/USD remained on the downside and breached the ascending trendline, unexpectedly changing the trend to a bearish one. We were expecting the pair to correct even higher, considering that the euro had been falling for two months, losing 800 pips in the process. However, the market decided otherwise. Look at the chart above. On September 29, the pair reached a high around the level of 1.0618, and last week, the price tried to break this high, but ended up with a "false breakout." Therefore, from a technical perspective, everything currently points to the euro's decline.
Take note that Friday's events had no impact on the pair's movement. The eurozone industrial production data turned out to be mixed. Industrial production increased by 0.6% in August, surpassing expectations. On the year, however, industrial production is still down by more than 5%, which was much worse than the most pessimistic forecasts. As we anticipated, European Central Bank President Christine Lagarde's speech didn't provide any new information.
EUR/USD on 5M chart
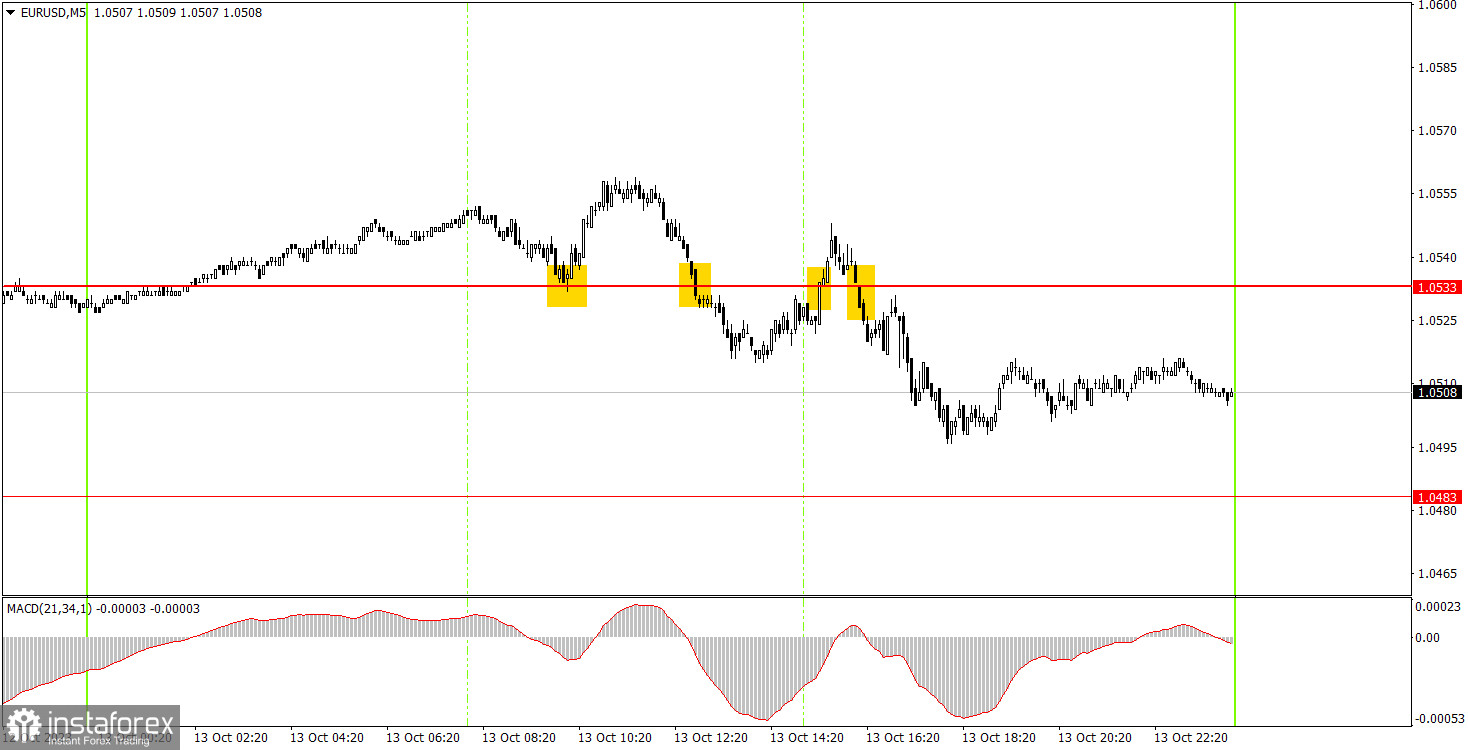
There were several signals on the 5-minute chart, but the intraday price movement wasn't exactly favorable. As a result, all the signals technically turned out to be false since the pair never reached the target level. Beginners could have executed the first two signals. A rebound from the level of 1.0533 allowed the pair to rise by 16 pips, while settling below 1.0533 led to a 9-pip drop. In the first case, a stop-loss was set to breakeven, and a small loss was incurred in the second case.
Trading tips on Monday:
On the 30-minute chart, the pair started to fall sharply and it could evolve into a new, full-fledged downtrend. We've repeatedly mentioned that we anticipate a dip in the euro in the medium-term perspective. We were expecting a stronger bullish correction, but the market decided differently. The key levels on the 5M chart are 1.0391, 1.0433, 1.0451, 1.0483, 1.0533, 1.0611-1.0618, 1.0673, 1.0733, 1.0767-1.0781, and 1.0835. A stop loss can be set at a breakeven point as soon as the price moves 15 pips in the right direction. On Monday, there are no important events scheduled in the European Union or the United States. A couple of ECB and Federal Reserve officials will speak, unfortunately these speeches currently don't have a strong influence on the market.
Basic trading rules:
1) The strength of the signal depends on the time period during which the signal was formed (a rebound or a break). The shorter this period, the stronger the signal.
2) If two or more trades were opened at some level following false signals, i.e. those signals that did not lead the price to Take Profit level or the nearest target levels, then any consequent signals near this level should be ignored.
3) During the flat trend, any currency pair may form a lot of false signals or do not produce any signals at all. In any case, the flat trend is not the best condition for trading.
4) Trades are opened in the time period between the beginning of the European session and until the middle of the American one when all deals should be closed manually.
5) We can pay attention to the MACD signals in the 30M time frame only if there is good volatility and a definite trend confirmed by a trend line or a trend channel.
6) If two key levels are too close to each other (about 5-15 pips), then this is a support or resistance area.
How to read charts:
Support and Resistance price levels can serve as targets when buying or selling. You can place Take Profit levels near them.
Red lines are channels or trend lines that display the current trend and show which direction is better to trade.
MACD indicator (14,22,3) is a histogram and a signal line showing when it is better to enter the market when they cross. This indicator is better to be used in combination with trend channels or trend lines.
Important speeches and reports that are always reflected in the economic calendars can greatly influence the movement of a currency pair. Therefore, during such events, it is recommended to trade as carefully as possible or exit the market in order to avoid a sharp price reversal against the previous movement.
Beginners should remember that every trade cannot be profitable. The development of a reliable strategy and money management are the key to success in trading over a long period of time.