empty
 
 
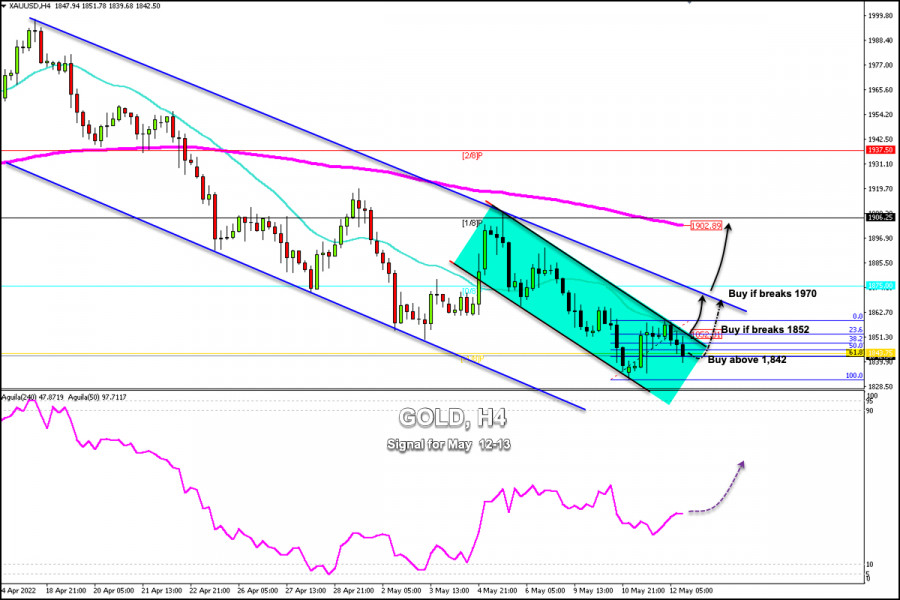
12.05.2022: Forex Analysis & Reviews: Trading Signal for Gold (XAU/USD) on May 12-13, 2022: buy above $1,842 (-1/8 Murray - 61.8% Fibonacci)
loader
外匯預測 05/02/2024:EUR/USD、USD/JPY 和黃金,Sebastian Seliga 撰文
2024-05-02 UTC+3
2024年5月2日的視訊市場更新
2024-05-02 UTC+3
2024年5月1日的視訊市場更新
2024-05-01 UTC+3
外匯預測 05/01/2024:EUR/USD、GBP/USD、USD/JPY、SP500和原油,作者是Sebastian Seliga。
2024-05-01 UTC+3
2024年4月30日的视频市场更新
2024-04-30 UTC+3
外匯預測 04/30/2024:EUR/USD、GBP/USD、USD/JPY、原油和比特幣,由Sebastian Seliga提供
2024-04-30 UTC+3
外匯預測 04/29/2024:EUR/USD、GBP/USD、USD/JPY、EUR/JPY、GBP/JPY以及BTC,由Sebastian Seliga提供
2024-04-29 UTC+3
2024年4月29日的視頻市場更新
2024-04-29 UTC+3
外匯預測 04/26/2024:EUR/USD, USD/JPY, 原油和比特幣,Sebastian Seliga撰文
2024-04-26 UTC+3
2024 年 4 月 26 日的視頻市場更新
2024-04-26 UTC+3
外匯預測 04/25/2024:EUR/USD、USDX、黃金和比特幣,Sebastian Seliga 由 Sebastian Seliga 提供
2024-04-25 UTC+3
2024年4月24日的视频市场更新
2024-04-24 UTC+3
外匯預測 04/24/2024:EUR/USD,USD/CAD,石油和比特幣,作者:Sebastian Seliga
2024-04-24 UTC+3
2024年4月23日的視頻市場更新
2024-04-23 UTC+3
外匯預測 04/23/2024: EUR/USD, GBP/USD, 油價, SP500 和比特幣,作者是Sebastian Seliga
2024-04-23 UTC+3
2024年4月22日的影片市場更新
2024-04-22 UTC+3
外匯預測 04/22/2024:歐元/美元,英鎊/美元,美元/日圓和比特幣,Sebastian Seliga提供
2024-04-22 UTC+3
2024年4月19日的视频市场更新
2024-04-19 UTC+3

analytics627d09421728d.jpg

Early in the American session, gold is falling, erasing part of the rebound from the low of 1,931. XAU/USD reached 1,858 in the Asian session, but then reversed direction and fell to 1,841.

Gold falls as a result of further declines in the world stock markets and concerns about global growth. This puts downward pressure on commodity prices and strengthens the US dollar.

According to the 4-hour chart, we can see that gold is trading at around 1,842. This level coincides with the 61.8% Fibonacci retracement (1,931-1,958).

We can also see that gold is trying to consolidate above -1/8 Murray located at 1,843, an extremely oversold level. If gold continues to trade above this level in the next few hours, we could expect a recovery.

Additionally, we can see that the 21 SMA is located at 1,852, just at the same level where the top of the short-term bearish channel is located. A sharp break above 1,852 and a close on the 4-hour chart could ease the downside pressure and gold could reach the level of 1,870.

We can see on the 4-hour chart that since April 14 gold has been under downward pressure after approaching the psychological level of 2,000.

A sharp break of this medium-term trend channel and a close on daily charts above 1,970 could mean a trend reversal and we could expect it to reach 200 EMA at 1,902 and could even reach 2/8 Murray at 1,937.

Our trading plan for the next few hours is to buy gold at around the 61.8% Fibonacci level at 1,842, with targets at 1,852 and 1,870. The eagle indicator is giving a positive signal which supports our bullish strategy.

*这里的市场分析是为了增加您对市场的了解,而不是给出交易的指示。

Dimitrios Zappas,
Analytical expert of InstaForex
© 2007-2024
  • Grand Choice
    Contest by
    InstaForex
    InstaForex always strives to help you
    fulfill your biggest dreams.
    JOIN CONTEST
  • Chancy Deposit
    Deposit your account with $3,000 and get $9000 more!
    In May we raffle $9000 within the Chancy Deposit campaign!
    Get a chance to win by depositing $3,000 to a trading account. Having fulfilled this condition, you become a campaign participant.
    JOIN CONTEST
  • Trade Wise, Win Device
    Top up your account with at least $500, sign up for the contest, and get a chance to win mobile devices.
    JOIN CONTEST
  • 100% Bonus
    Your unique opportunity to get a 100% bonus on your deposit
    GET BONUS
  • 55% Bonus
    Apply for a 55% bonus on your every deposit
    GET BONUS
  • 30% Bonus
    Receive a 30% bonus every time you top up your account
    GET BONUS
现在无法通话?
提出您的问题,用 在线帮助.
Widget callback