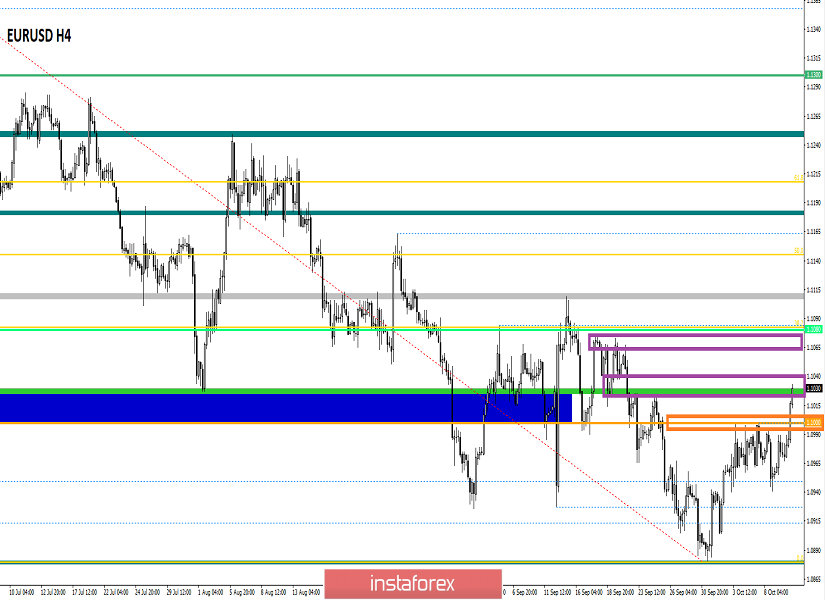
The euro/dollar currency pair showed low volatility of 35 points over the last trading day, but this was enough to radically change the picture. From the point of view of technical analysis, we have a very interesting picture. A local surge in the price on October 8 did not lead to anything cardinal, except for a short-term breakdown of the lower boundary of the flat formation of 1.0960/1.0990 (1.1000). The subsequent process, as we can already see, was in terms of return, where, with surgical accuracy, the quote fell to the border of 1.0990 (1.1000), there it hung until the end of the trading day.
As discussed in the previous review, the actions of traders were quite multidirectional, so, some decided to leave short positions after touching the first control point of 1.0940, then waiting for the price to fix below it (1.0940). Other traders did not manage with a simple fixation of positions and decided to ride a local surge in the direction of 1.0990. No further action was taken, as the afternoon was in terms of narrow sideways.
Considering the trading chart in general terms (daily period), we see that we can't just get rid of the correction, the border of 1.0990 (1.1000) is already cracking under the onslaught of buyers, which can result in an elongated correction. The main trend remains downward, its changes are not discussed, but a temporary stop in the form of a correction is possible. The current scenario is somewhat similar to the pound/dollar currency pair, but before the elongated correction, we touched historical lows, which cannot be said about the euro/dollar pair.
The news background of the past day contained data on open vacancies in the United States labor market (JOLTS), where previous data revised for the worse (7.217M – 7.174M) and the current figures came out even worse than the forecast of 7.051M. If we compare the JOLTS data with the trading chart, we will see that they did not affect the dynamics of the dollar in terms of its weakening, probably due to the fact that there was already a sharp jump in the price. The key event of the day in terms of the economic calendar was the publication of the text of the minutes of the meeting of the Federal Committee on Open Market Operations, where they waited for some interesting details about the risks of recession, but received all the same that they already knew. If we delve into the details of the minutes, the meeting participants generally believe that downside risks to the forecast of economic activity increased slightly compared to the July meeting, especially the risks associated with uncertainty in trade policy and with external conditions. Several participants still pointed to a significant increase in the likelihood of a recession in the United States. The reaction to the protocol was almost zero due to the coincidence of all previously announced information.
The informational background contained a few splashes regarding Brexit. Now, EU leaders criticized the proposal of British Prime Minister Boris Johnson regarding Brexit and accused him of promoting unconstructive and vague ideas for solving the issue of the Irish border. In fact, we have a refusal from the EU even before the summit, which everyone is waiting for. In turn, European Commission President Jean-Claude Juncker said that the EU continues discussions with Britain on Brexit, and Juncker does not rule out a possible agreement.
Today, in terms of the economic calendar, we have data on inflation in the United States, where, according to preliminary forecasts, expect growth from 1.7% to 1.8%-1.9%. In fact, if the data is confirmed, the US dollar may receive an incentive to grow.
Further development
Analyzing the current trading chart, we see a mystical oscillation, with which the price managed to overcome the frame of 1.0990 (1.1000) and move to a fixation above it with the preservation of bullish interest. What is the mystique here? There is no standing foundation of information and if you analyze the trading chart every minute, we will see that there is a synchronicity of jumps of the past day and today. That is, let's go to the minute chart and analyze the sections 9:15-11:15 and 9:15-12:30 (time on the trading terminal). There are similarities and no foundation, only theories. One of the theories says that there is a certain machine for opening large positions, but, I repeat, this theory is not a fact.
In turn, traders probably already broke into long positions as soon as the price fixing went above the mark of 1.1000.
It is likely to assume that the upward momentum will not last as long as many would like, and already within the coordinates of 1.1030, a maximum of 1.1070, there will be a stop with a subsequent return of the price. The word "oblong correction" flies out of this impulse and a lumbago of the level of 1.1000. Let's see what will happen next and whether this theory will be confirmed.
Based on the above information, we derive trading recommendations:
- Buy positions are already available to traders as soon as the price has passed the level of 1.1000. In previous reviews, we have repeatedly mentioned this entry point.
- We don't have a sell position at the moment, now we should carefully analyze the behavior of the quotation and the stopping point, after which it will look where it is better to enter the market.
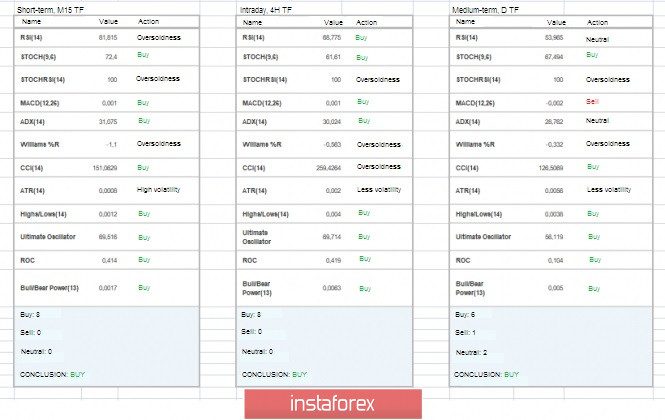
Indicator analysis
Analyzing the different sector of timeframes (TF), we see that the indicators in all major time areas signal an upward move, and what is surprising, we have a corrective move and impulse movement in it. So all our indicators turned around.
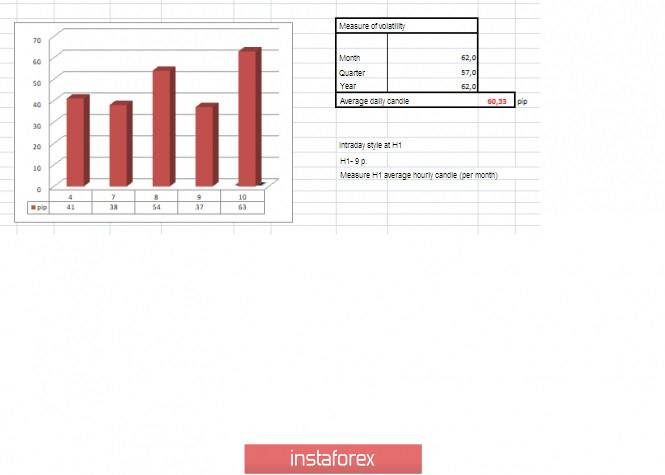
Volatility per week / Measurement of volatility: Month; Quarter; Year.
Measurement of volatility reflects the average daily fluctuation, calculated for the Month / Quarter / Year.
(October 10 was built taking into account the time of publication of the article)
The volatility of the current time is 63 points, which already exceeds the daily average by 5%, and the volatility continues to grow. There is a chance that we will see more growth, but I doubt that it will be large. Thus, another slowdown and repetition of yesterday is possible.
Key levels
Resistance zones: 1.1100**; 1.1180*; 1.1300**; 1.1450; 1.1550; 1.1650*; 1.1720**; 1.1850**; 1.2100
Support zones: 1.1000***; 1.0900/1.0950**; 1.0850**; 1.0500***; 1.0350**; 1.0000***.
* Periodic level
** Range level
*** Psychological level
**** The article is based on the principle of conducting transactions, with daily adjustments.