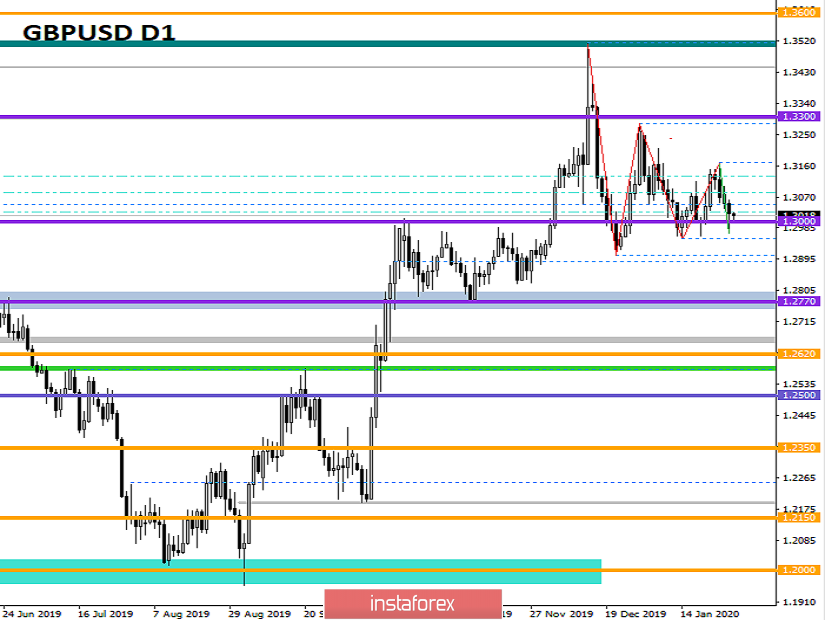
From a complex analysis point view, we see an attempt to break down the psychological level of 1.3000, where the quote punctures the control value and then bounces due to local acceleration. In fact, we once again saw the interaction of market participants with a range of psychological level, where, due to regularities, trade operations were fixed and rebounded. We have repeatedly observed this phenomenon in history with respect to this coordinate, for this reason we were ready for a bear trap and considered the main move only if the price was fixed below the value of 1.2960.
Regarding the theory of the Zigzag-shaped model, we observe the successive formation of phases, where the third phase supposedly reached its limit of 1.3000. If the completion of the phase is confirmed, then clamping the market relative to the period of the Zigzag-shaped model can give a signal of speedy acceleration, which will lead to a fracture of the Z-model. Traders suggest that the model itself is a harbinger of a downward trend recovery, which gives rise to thought.
In terms of volatility, we see local acceleration, about 40% relative to Tuesday. At the same time, the dynamics of the quotes in the past days are almost equal to the average daily indicator, which is a good sign from the point of view of the activity of market participants.
Detailing the minute by minute, we see that the inertial downward move was set at the start of the European trading session and lasted until 15:00 UTC [time on the trading terminal]. The subsequent fluctuation was in terms of a rebound of about 50 points.
As discussed in the previous review, traders actively worked to lower, almost from the very beginning of inertia, topping up in the region of 1.3055. As a result, we made substantial profits and, in the region of the psychological level of 1.3000, fixed trading operations. I congratulate everyone on the next profit, I think we will not stop there.
Considering the trading chart in general terms [the daily period], we see the compression of quotes relative to each subsequent measure from mid-December. Let me remind you that this phenomenon occurs at the conditional peak of the medium-term upward trend, which gives a signal about a possible change of interests.
The news background of the past day included data on orders for durable goods in the United States, the volume of which grew by 2.4% compared to the period earlier, where there was a decline of 3.1%. Also, data on prices for housing [S & P / CaseShiller], where expectations coincided and we saw an acceleration from 2.2% to 2.6%.
Market reaction to statistics was coupled with a general strengthening of the dollar.
In terms of the general information background, data appeared that the start of negotiations between the UK and the European Union on future trade relations will begin on March 3. On the EU side, a constant negotiator in the person of Michel Barnier will speak, and David Forst on the British side. I note that a few days earlier, during the press conference, Michel Barnier did not evaluate the prospect of Boris Johnson in the shortest possible time to complete the transition period, emphasizing that there will never be compromised on the single market.
Today, in terms of the economic calendar, we have a meeting of the Federal Reserve System [FRS], where most experts are inclined to believe that the Fed will refrain from changing monetary policy. At the same time, at a press conference, we can see comments regarding future actions that will just put pressure on the quotes. In any case, this event will interest many speculators.
19:30 UTC press conference of the Federal Open Market Committee of the Fed
Further development
Analyzing the current trading chart, we see a chatter within the psychological level of 1.3000, where downward interest is still maintained. In fact, the recent rebound made it possible to regroup trading forces and now comes the most crucial moment, fixing the quotes. In terms of the theory of the Zigzag-shaped model, we can see a stop that represents the finish of the phases and which will give a start to the fracture of the model itself. As you know, the fracture of the Z-model leads to acceleration, and the level of 1.3000, in this case, can perfectly play a starting point in terms of reduction.
From the point of view of the emotional mood of the market, we see caution in terms of the actions of market participants, which is a justified reaction when there is a strong coordinate under the quotes.
By detailing the time interval that we have per minute, we see that the night stagnation [1,3014 / 1,3026] was locally broken down, where it almost touched the level of 1,3000, but after which we again returned to the previously passed frames.
In turn, traders fixed previously having short positions and switched to the analysis of clear signals. The focus is on the coordinates 1.2960 since this level is responsible for the further downward movement.
Having a general picture of actions, it is possible to assume that the chatter within the control level of 1.3000 will still remain, where traders are in no hurry to fly into the market. In this regard, the most optimal method is to analyze the knowledge of 1.2960 for fixation points and the main move, as well as 1.3040-45 for local long positions. At the same time, it is worthwhile to be prepared for local lumbago by shadows in case of a jump in volatility, thereby we are particularly interested in fixing prices.
Based on the above information, we derive trading recommendations as follows:
- Buy positions are considered in case of another rebound from the psychological level of 1.000, where local positions will be higher than 1.3040-45 at the time of exit.
- Sales positions are the main transactions where traders are waiting for a clear price-fixing lower than 1.2960.
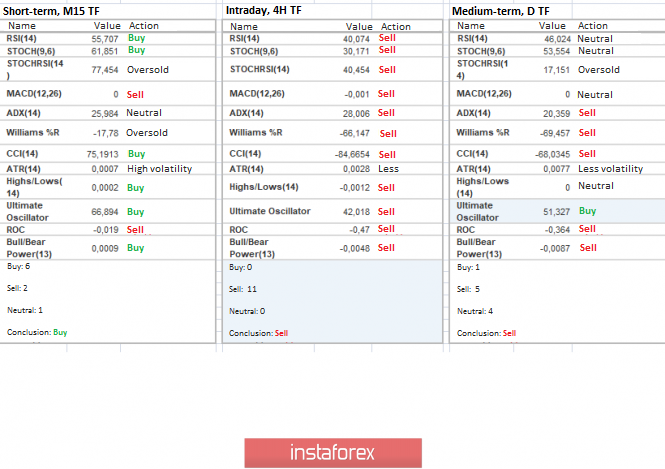
Indicator analysis
Analyzing a different sector of timeframes (TF), we see that the indicators of technical instruments regarding hourly and daily periods signal sales. At the same time, minute intervals have a variable signal that is worth filtering.
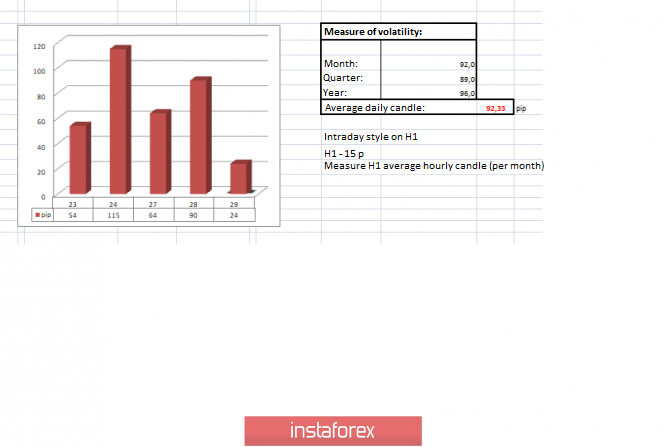
Volatility per week / Measurement of volatility: Month; Quarter; Year
Measurement of volatility reflects the average daily fluctuation, calculated for Month / Quarter / Year.
(January 29 was based on the time of publication of the article)
The volatility of the current time is 24 points, which is a low indicator for this time section. It is likely to assume that if speculators manage to swing the market against the backdrop of the Fed meeting, then volatility may accelerate, otherwise the stagnation will last much longer than planned.
Key levels
Resistance zones: 1.3180 **; 1.3300 **; 1.3600; 1.3850; 1.4000 ***; 1.4350 **.
Support Areas: 1,3000; 1.2885 *; 1.2770 **; 1.2700 *; 1.2620; 1.2580 *; 1.2500 **; 1.2350 **; 1.2205 (+/- 10p.) *; 1.2150 **; 1,2000 ***; 1.1700; 1.1475 **.
* Periodic level
** Range Level
*** Psychological level
**** The article is built on the principle of conducting a transaction, with daily adjustment