From the point of view of complex analysis, we see a downward interest, where the relatively recent upward move has been worked out more than half, and now about the details. The previous day was not marked by high activity, as it was on the GBPUSD currency pair, but in our case, there was a reverse move, which managed to preserve the recovery process. In fact, the quote once again returned to the upper limit of the last week's range (1.0980/1.1040), where we stubbornly stood with low activity. This point is variable support and this is confirmed by the minimum of the move on February 3. At the same time, such a rapid return of the price to the framework of the previous fluctuation suggests that the end of the downward course set in early January is not yet over.
We are not yet talking about the recovery process from the oblong correction since the price has not yet approached the ill-fated psychological level of 1.1000.
In terms of volatility, we see a 28% slowdown relative to the daily average. As for the dynamics since the beginning of the trading week, the slowdown is more than half. In fact, market participants went into standby mode at the time of the descent on February 3.
Analyzing the past day by the minute, we see that after the morning stagnation within the area of 1.1055/1.1065, the quote broke the lower border, just at the start of the European trading session. After that, a tiresome low-active move followed by a slowdown, but already around the mark of 1.1040.
As discussed in the previous review, speculators were working for a decrease from the fixing area of 1.1060/1.1065, where they made partial and full closing of deals when the value of 1.1040 was reached. Further actions were considered from the price-fixing points relative to the values of 1.1040 and 1.1065.
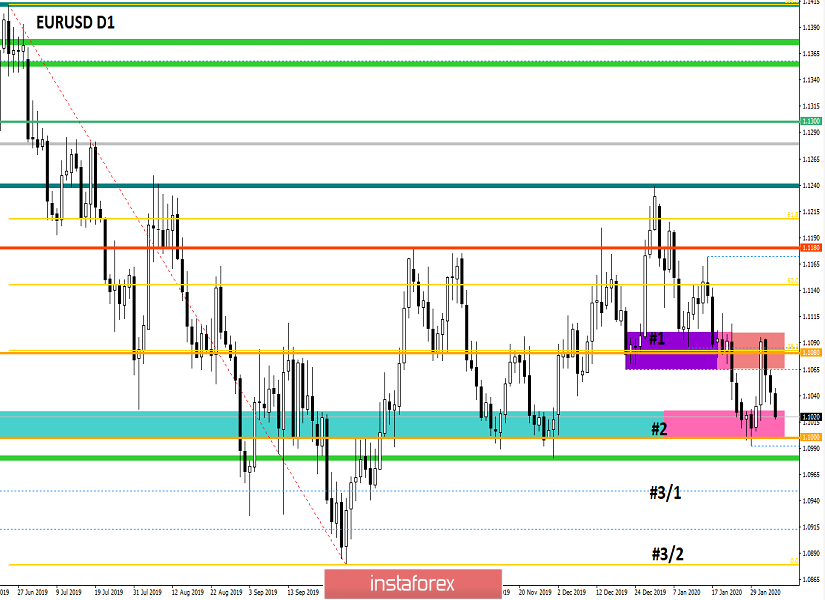
Looking at the trading chart in general terms (the daily period), we see a four-month oblong correction, where a full recovery process is trying to form, but so far only managed to gain a foothold between the first (1.1080) and the second (1.1000) recovery stage.
The news background of the previous day included data on producer prices in Europe, where there was a characteristic improvement of -1.4% -> -0.7%, but we still remain in the negative zone for at least five months. For the United States, data on industrial orders were published, where growth was recorded to 1.8% with a forecast of 1.2%.
The market reaction was absent on the European statistical data, which is understandable, but the data on the States played in favor of strengthening the dollar.
In terms of the general information background, we see the same noise associated with the coronavirus, the Brexit transition period, and the impeachment of Trump. All this affects the opinion and actions of market participants, but there were no strong noises recorded in the tap on the previous day, so we take a pause and continue monitoring the background.
Today, in terms of the economic calendar, we had data from the PMI in Europe, where the composite PMI rose from 50.9 to 51.3, and the PMI in the services sector came out better than expectations of 52.5. An hour after the PMI, data on retail sales in the eurozone came out, where they expected acceleration from 2.2% to 2.5%, but received a slowdown to 1.3%. The most interesting point was the fact that the euro started to decline for half an hour earlier than published data on retail sales, and the question is – who leaked the statistical data?
In the second half of the day, we are waiting for the ADP report on the level of employment in the private sector of the United States, where they predict a decrease in comparison with the previous period (202 thousand -> 156 thousand).
Further development
Analyzing the current trading chart, we see that the quote has overcome the point of variable support and plunged inside the range of 1.0980/1.1040, where the focus is on the psychological level of 1.1000. In fact, this happened at the very moment when the retail statistics began to put pressure on the euro, and now the question arises whether the price will be able to hold. Regarding the recovery process, we are getting closer to resuming discussions, but there is no need to hurry, let the quote first reach the level of 1.1000.
In terms of the emotional mood of market participants, we have a characteristic decline, where an attempt to resume activity was recorded, but there are not enough speculative positions yet.
In turn, traders are not in a hurry to take action, as the experience of the past week showed that fluctuations within the level of 1.1000 are insignificant and it is better to work on getting out of control points. In turn, speculators disagree with this and consider a local move to the level of 1.1000.
It is likely to assume that the quote will focus on the range of 1.1000/1.1040, where you should monitor the behavior and price-fixing points. So, if you hold the boundaries inside, you can consider extending them to the limit of the control values of 1.0980//1.1000//1.1040. If the mood changes and the price is fixed higher than 1.1045-50, an alternative rebound scenario will be considered.
Based on the above information, we will output trading recommendations:
- Buy positions will be considered if the price is fixed higher than 1.1045-50.
- We consider selling positions in terms of a local descent to 1.1000. The main move is considered if the price is clearly fixed below 1.0980, H4.
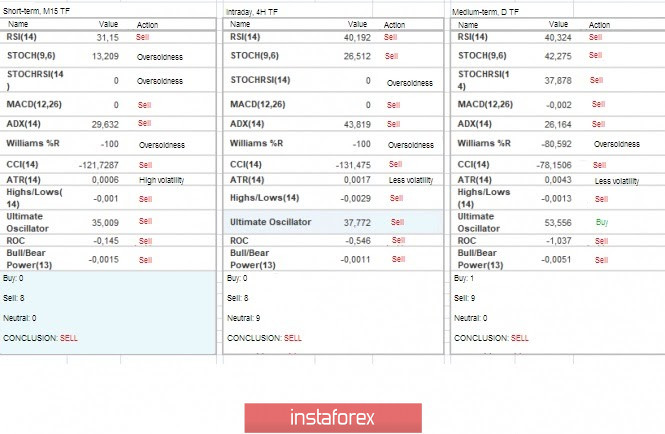
Indicator analysis
Analyzing different sectors of timeframes (TF), we see that due to the return to the framework of the recent fluctuations, the indicators of technical instruments have taken a downward direction.
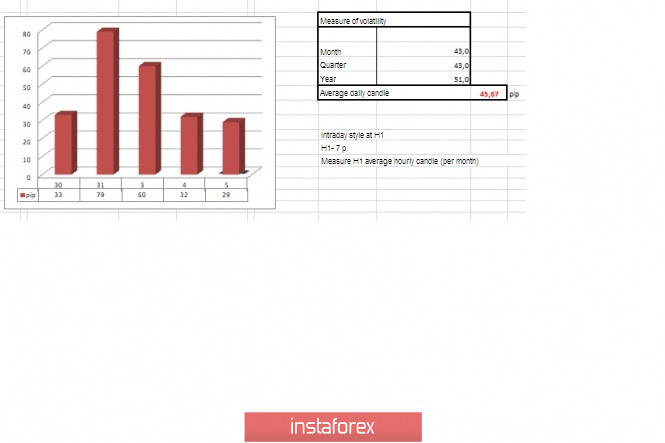
Volatility for the week / Volatility Measurement: Month; Quarter; Year.
The volatility measurement reflects the average daily fluctuation, based on the calculation for the Month / Quarter / Year.
(February 5 was based on the time of publication of the article)
The current time volatility is 29 points, which is still a low indicator. It is likely to assume that if the data on the employment rate comes out better than expected, the volatility may increase several times and we will see the range expand to the border of 1.0980.
Key levels
Resistance zones: 1.1080**; 1.1180; 1.1300**; 1.1450; 1.1550; 1.1650*; 1.1720**; 1.1850**; 1.2100.
Support zones: 1.1000***; 1.0900/1.0950**;1.0850**; 1.0500***; 1.0350**; 1.0000***.
* Periodic level
** Range level
*** Psychological level
***** The article is based on the principle of conducting a transaction, with daily adjustments.