EUR/USD 1H
The EUR/USD pair continued absolutely indistinct trading on the hourly timeframe on October 1, which it has done in recent months. Recall that the pair's quotes left the 200-point horizontal channel just recently, in which it has spent around two months in. Yesterday, trading was held in a narrow, approximately 60-point range with no specific direction. Nevertheless, this was enough to leave the descending channel, even though it was met with difficulty, but it still retained the prospect of a downward trend in recent days. Buyers also managed to overcome the resistance area of 1.1704-1.1728, but have not yet managed to gain a foothold above the Senkou Span B line. Thus, moving further up is also questionable.
EUR/USD 15M

Both linear regression channels are directed slightly to the upside on the 15-minute timeframe, but they can change the direction at any moment. The euro/dollar fell by about one and a half cents last reporting week (September 16-22). Recall that the previous Commitment of Traders (COT) report showed that the "non-commercial" group of traders, which we have repeatedly called the most important, sharply reduced their net positions. Thus, in general, the downward movement that began later on was sufficiently substantiated. The only problem is that it started late. The new COT report, which only covers the dates when the euro began its long-awaited fall, showed completely opposite data. Non-commercial traders opened 15,500 new Buy-contracts (longs) and almost 6,000 Sell-contracts (shorts) during the reporting week. Thus, the net position for this group of traders has increased by around 9,000, which shows that traders are becoming bullish. Accordingly, the behavior of the EUR/USD pair and the COT report data simply do not match. For the second week in a row. However, if you try to look at the overall picture, you can still take note of a very weak strengthening of the bearish sentiment, so the COT report allows a slight fall in the euro. The question is, will it continue to decline or is it already over? The pair even managed to rise by 40 points from September 23-29. Therefore, there are no such changes again.
The European Union and some of its countries published indexes of business activity in industrial sectors on Thursday. Without going into the numbers, we can say that none of the indices fell below the key level of 50.0 and did not significantly decline compared to the previous month. The unemployment rate in the European Union rose, as predicted by experts, to 8.1%. There have also been several relatively significant publications in the United States. The number of initial claims for unemployment benefits was 837 thousand, and the total number of secondary claims fell to 11.767 million. Thus, the overall unemployment rate in the United States continues to decline. Personal incomes of Americans decreased by 2.7% in August, personal expenses increased by 1%. The ISM manufacturing PMI fell from 56.3 points to 55.4. Markit PMI - from 53.5 to 53.2. Thus, we see that all the reports of the past day were either secondary initially, or their real values did not differ much from the forecasted ones. And also do not forget that market participants continue to ignore almost all macroeconomic data.
We have two trading ideas for October 2:
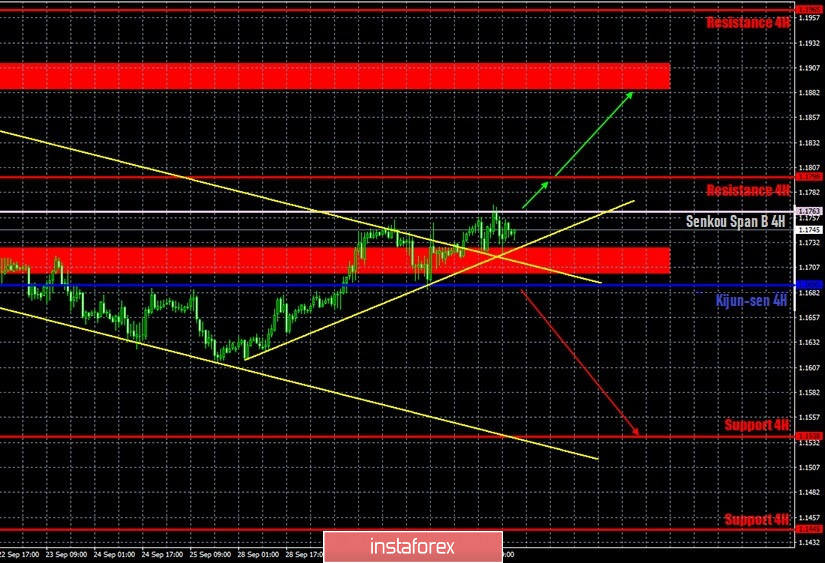
1) Buyers continue to put pressure on the pair, but it is still not enough to break the downward trend, although the price still went out of the descending channel with grief. Therefore, long positions will formally be relevant above the Senkou Span B line (1.1763) with targets at 1.1798 and the resistance area of 1.1886-1.1910, but the upward movement is now extremely uncertain. Take Profit in this case will be from 20 to 110 points.
2) Bears have finally released the market from their hands. However, an upward trend line may come to their aid. If the price settles below this line, then the trend for the pair will change to a downward one. We recommend resuming bearish trading while aiming for the support level of 1.1538 if the bears manage to get the pair back below the critical line (1.1690). In this case, the potential Take Profit is up to 130 points.
Explanations for illustrations:
Support and Resistance Levels are the levels that serve as targets when buying or selling the pair. You can place Take Profit near these levels.
Kijun-sen and Senkou Span B lines are lines of the Ichimoku indicator transferred to the hourly timeframe from the 4-hour one.
Support and resistance areas are areas from which the price has repeatedly rebounded off.
Yellow lines are trend lines, trend channels and any other technical patterns.