Review:
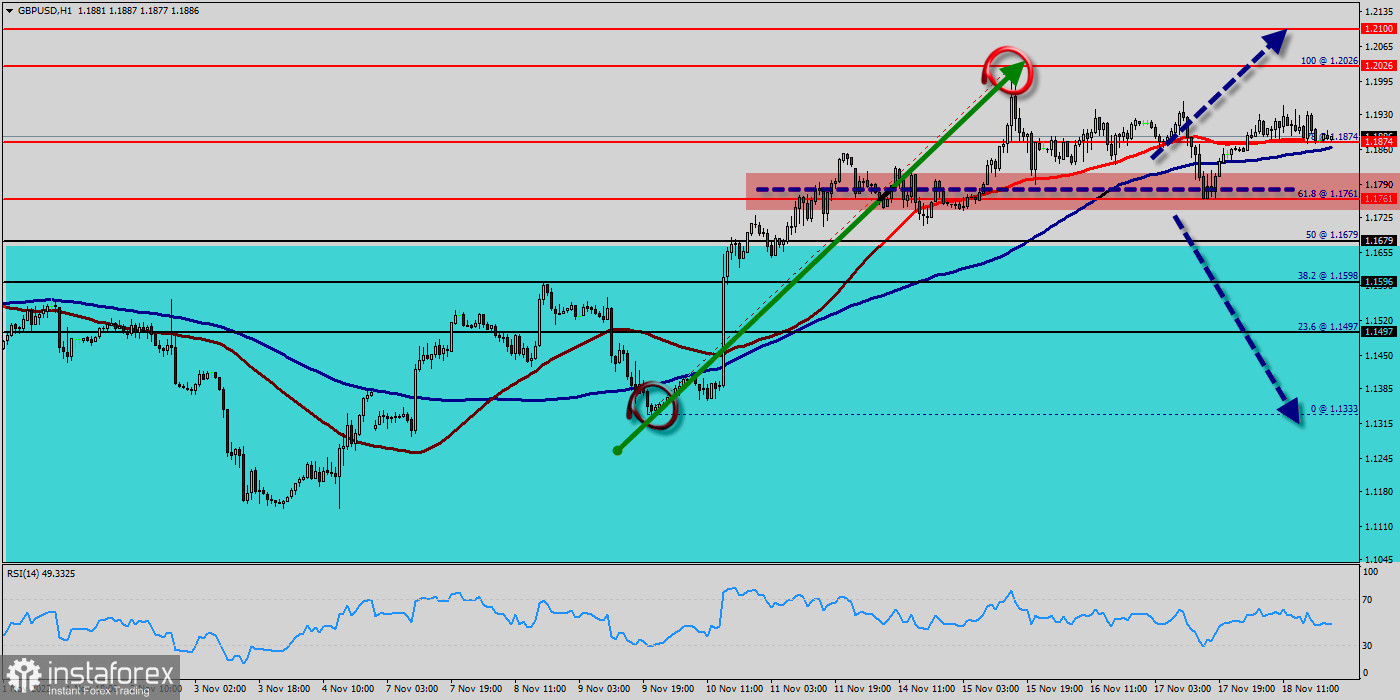
The GBP/USD pair moved higher and closed the day in positive area near the price of 1.1874. It also rose a little, having risen to the level of 1.1900. On the hourly chart, the GBP/USD pair is still testing resistance (1.2026) - the moving average line MA (100) H1 (1.1874). The GBP/USD pair continues to push higher toward 1.1900 during the American trading hours on Monday. The dollar stays under constant selling pressure after the ISM Manufacturing PMI survey showed price pressures continued to ease in August. Range trading continues in the GBP/USD pair and intraday bias stays upwards at this point. The GBP/USD pair was trading around the area of 1.1900 a week ago. Today, the level of 1.1761 represents a daily pivot point in the H1 time frame. The pair has already formed minor resistance at 1.1900 and the strong resistance is seen at the level of 1.2026 because it represents the daily resistance 2.
On the upside, above 1.1459 minor resistance will target 1.1900 resistance first. Break there will target channel resistance at 1.2026. It should be noted that volatility is very high for that the GBP/USD pair is still moving between 1.1761 and 1.2026 in coming hours. Furthermore, the price has been set above the strong support at the levels of 1.1761 and 1.2026, which coincides with the 61.8% and 100% Fibonacci retracement level respectively. Further recovery should motivate the pair to challenge recent highs around 1.2026 to allow for extra gains to, initially, the interim hurdle at the 50-day EMA at 1.1900. The market is indicating a bullish opportunity above the above-mentioned support levels, for that the bullish outlook remains the same as long as the 50 EMA is headed to the upside Bias will be back on the upside for retesting 1.2026 high. On the upside, above 1.1761 will resume the rebound to 1.1761 resistance turned support.
All elements being clearly bullish market, it would be possible for traders to trade only long positions on the GBP/USD pair as long as the price remains well above the price of 1.1761. The GBP/USD pair will continue rising from the level of 1.1761 in the long term. It should be noted that the support is established at the level of 1.1761 which represents the last bearish wave. The price is likely to form a double bottom in the same time frame. Accordingly, the GBP/USD pair is showing signs of strength following a breakout of the highest level of 1.1761. So, buy above the level of 1.1761 with the first target at 1.1875 in order to test the daily resistance 1. The buyers' bullish objective is set at the level of 1.2026 (last bullish wave).
A bullish break in this resistance would boost the bullish momentum. The buyers could then target the resistance located at 1.2026. This suggests that the pair will probably go up in coming hours. If the trend is able to break the level of 1.2026 (double top), then the market will call for a strong bullish market towards the objective of 1.2026 this week. If there is any crossing, the next objective would be the resistance located at 1.2100. The level of 1.2100 is a good place to take profits. Moreover, the RSI is still signaling that the trend is upward as it remains strong above the moving average (100). Since the trend is above the 61.8% Fibonacci level (1.1761), it means the market is still in a uptrend. From this point, the GBP/USD pair is continuing in a bullish trend from the new support of 1.1761.
This is shown to us as the current price is in a bullish channel. According to the previous events, we expect that the GBP/USD pair will move between 1.1761 and 1.2100 in coming hours. However, beware of bullish excesses that could lead to a possible short-term correction; but this possible correction would not be tradeable. On the other hand, in case a reversal takes place and the GBP/USD pair breaks through the support level of 1.1761, a further decline to 1.1596 can occur. It would indicate a bearish market.
On the downside :
If The price is in a bearish channel in coming time. Amid the previous events, the pair is still in an uptrend. On the one-hour chart, the GBP/USD is still below the MA 50H4 line. Based on the foregoing, it is probably worth sticking to the south direction in trading, and while the GBP/USD pair remains below MA 50 H1, it may be necessary to look for entry points to sell at the end of the correction. Areak of 1.2026 minor support will bring retest of 1.1761 and 1.1679 low instead.
Forecast :
Pound Sterling is currently trading at 1.1850. However, if the trend reverses from this point, then a possible future share price target could be 1.2026. If the price of Pound Sterling is trading above 1.2026 then possibility of upside targets getting achieved is higher around the level of 1.2100.