Esta sección presenta la información más importante sobre las operaciones con InstaForex. Proporcionamos análisis de reconocidos expertos para traders experimentados y artículos sobre las condiciones de negociación para principiantes. Nuestro servicio le ayudará a aumentar su potencial de ganancias.
Ver también
Esta sección está diseñada para aquellos que recién comienzan a operar en Forex. Los materiales educativos y analíticos de InstaForex satisfarán sus necesidades de capacitación. Las recomendaciones de nuestros expertos harán que sus primeros pasos hacia el éxito financiero sean simples y claros.
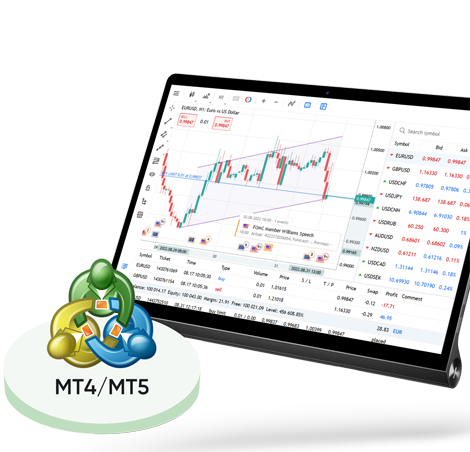
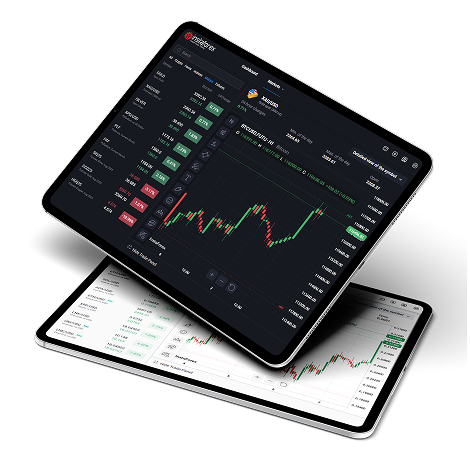
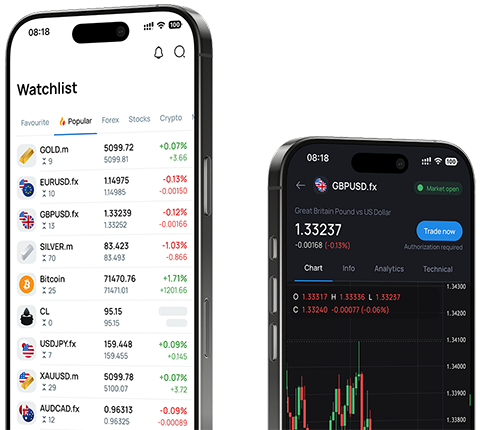
Los servicios innovadores de InstaForex son un elemento esencial para una inversión productiva. Nos esforzamos por brindar a nuestros clientes capacidades técnicas avanzadas y hacer que su rutina comercial sea cómoda, ya que somos reconocidos como el mejor bróker en este sentido.
La asociación con InstaForex es beneficiosa y de primer nivel. Únase a nuestros programas de afiliación y disfrute de bonos, recompensas de socios y la posibilidad de viajar con el equipo de la marca reconocida a nivel mundial.
Esta sección contiene las mejores ofertas de InstaForex. Reciba bonos al recargar su cuenta, compita con otros traders, y reciba premios reales incluso cuando opere en una cuenta demo.
Los días festivos con InstaForex no solo son agradables, sino también útiles. Ofrecemos un portal único, numerosos foros y blogs corporativos, donde los traders pueden intercambiar experiencias e integrarse con éxito en la comunidad Forex.
InstaForex es una marca internacional creada en 2007. La compañía brinda servicios para las operaciones de divisas en línea y es reconocida como uno de los brókers líderes en el mundo. Nos hemos ganado la confianza de más de 7,000,000 traders minoristas, quienes ya han apreciado nuestra confiabilidad y enfoque en la innovación.