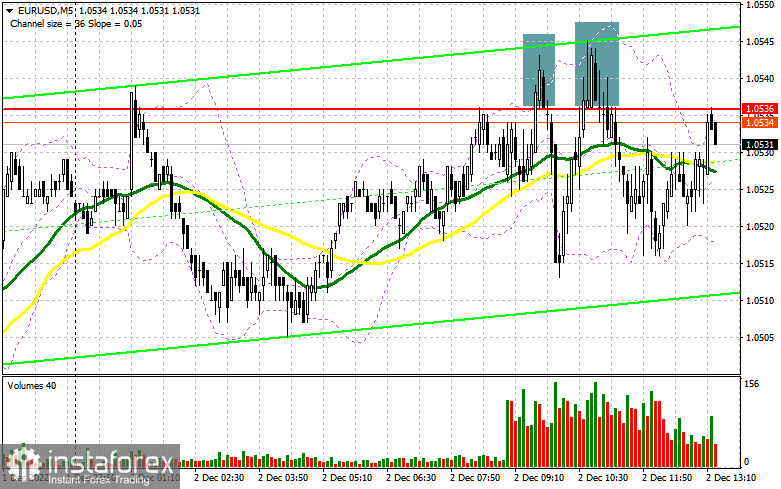
In my morning review, I mentioned the level of 1.0536 and recommended entering the market from there. Let's see what happened on the 5-minute chart. While rising to 1.0536, the pair formed several false breakouts which served as buy signals. After that, the pair declined by around 20 pips but failed to develop a strong downtrend. The technical picture and the trading strategy haven't changed for the second half of the day.
For long positions on EUR/USD:
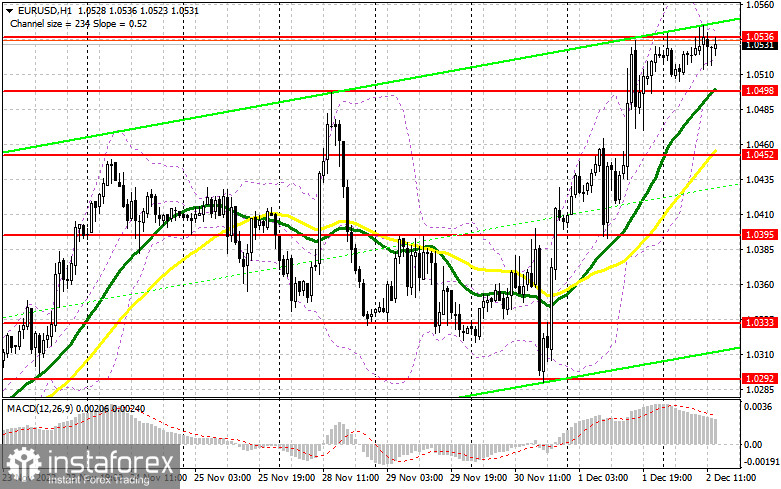
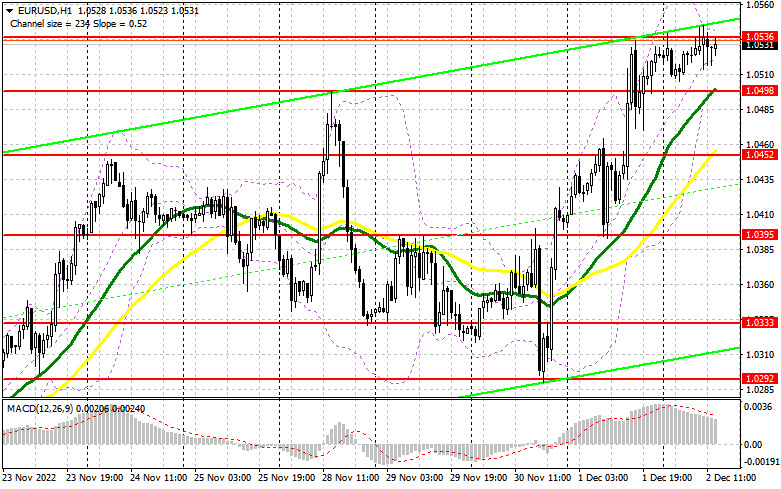
I expect the euro to keep rising in the second half of the day amid weaker-than-expected employment data in the US. Markets are waiting for the reports on the unemployment rate and nonfarm payrolls. A sharp drop in the number of new jobs will weigh heavily on the US dollar and support the euro. Even if the actual data exceeds the forecast, the pair is unlikely to drop too far. Traders may want to take advantage of the falling euro and will buy it at the daily lows, especially near the support of 1.0498 where moving averages limiting the fall of the euro are located. In case of a decline, only a false breakout at his range will form a buy signal and pave the way for the retest of 1.0536. The pair has already tested this level three times in the first half of the day. A breakout of this range and its downward retest that was failed by the bulls in the early trade will reinforce the bullish bias and will pave the way towards 1.0568. If the price settles above this range on negative jobs data, it may then develop a rise to the new monthly high of 1.0604 where I recommend profit taking. If EUR/USD declines in the New York session and buyers are idle at 1.0498, traders will start taking profit at the end of the month, thus putting more pressure on the euro. If so, only a false breakout at the next support of 1.0457 will be a reason to buy the pair. Going long on EUR/USD right after a rebound is advisable only at the level of 1.0395 or at the low of 1.0333, keeping in mind a possible upside correction of 30–35 pips within the day.
For short positions on EUR/USD:
The best moment to sell the pair in the second half of the day will be a false breakout at 1.0568. The price is unlikely to return to 1.0536 after nonfarm payrolls are published. The pair may test this level at the moment when the fundamental data on average hourly earnings and participation change is published in the US. This will create an entry point and will provoke a decline in the euro to the nearest support of 1.0498. Consolidation near this range and its upward retest will create an additional sell signal with triggered stop-loss orders set by the bulls. In this case, the euro may drop to 1.0452 where I recommend profit taking. The level of 1.0395 will serve as the lowest target. The pair may head there only if the US labor market shows unprecedented strength. If EUR/USD moves up in the US trade and bears are idle at 1.0568, speculative sellers will start leaving the market. This will reinforce the bullish presence and will help them resume the uptrend by opening the way to 1.0604. Selling at this level can be done only after a false breakout. Going short on EUR/USD right after a rebound is advisable only from the high of 1.0640, bearing in mind a downward correction of 3–35 pips within the day.
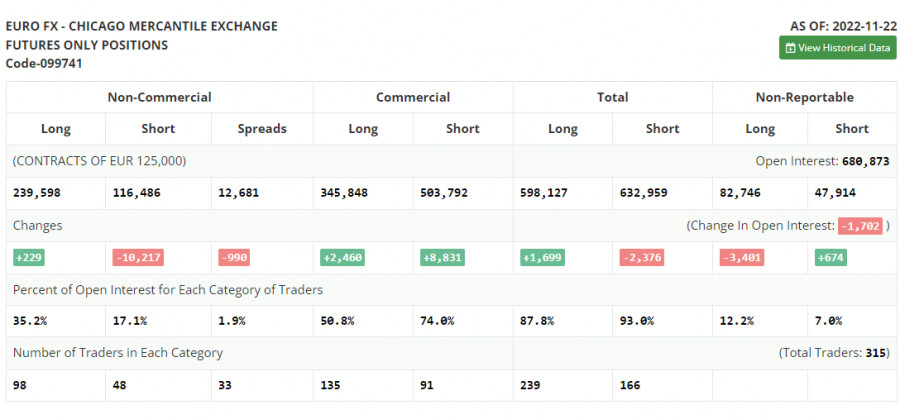
COT report
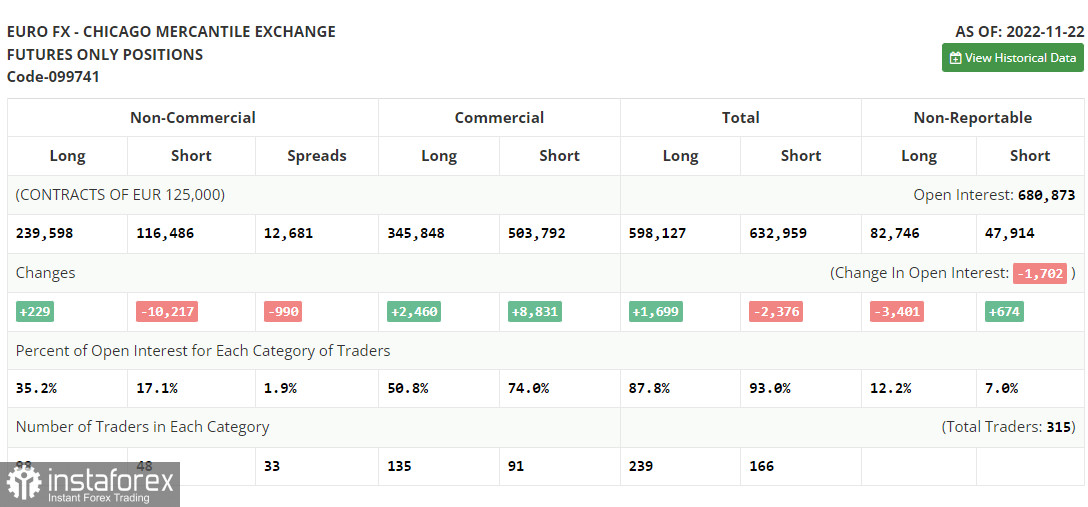
The Commitments of Traders report for November 22 recorded a rise in long positions and a sharp drop in short ones. The statement made by the Fed officials allowed bulls to gain ground in the market. It seems that traders hope that the US regulator will change its aggressive approach to monetary policy. The upcoming data on the US GDP and labor market will be a decisive factor to shape the sentiment of the market. The inflation report for November will complete the picture. A drop in the number of new jobs and a higher unemployment rate will weaken the position of the US dollar against risk assets, including the euro. Investors also need to carefully monitor statements made by Fed officials. If the stance of the US central bank becomes more hawkish, this will provoke more selling in the US dollar. The reason behind this is that the further rate hike will push the economy closer to a bigger recession. According to the COT report, long positions of the non-commercial group of traders rose by 229 to 239,598 while short positions dropped sharply by 10,217 to 116,486. Last week, the overall non-commercial net position increased to 123,112 from the previous reading of 112,666. This indicates that investors are taking advantage of a cheaper euro and continue to buy it even though it is holding above the parity level. They might also be accumulating long positions in hope that the pair will start to recover sooner or later. The weekly closing price declined to 1.0315 from 1.0390 a week ago.
Indicator signals:
Moving Averages
Trading above the 30- and 50-day moving averages indicates the dominance of the euro bulls.
Please note that the time period and levels of the moving averages are analyzed only for the H1 chart, which differs from the general definition of the classic daily moving averages on the D1 chart.
Bollinger Bands
In case of a decline, the lower band of the indicator at 1.0320 will serve as support.
Description of indicators:
• A moving average of a 50-day period determines the current trend by smoothing volatility and noise; marked in yellow on the chart;
• A moving average of a 30-day period determines the current trend by smoothing volatility and noise; marked in green on the chart;
• MACD Indicator (Moving Average Convergence/Divergence) Fast EMA with a 12-day period; Slow EMA with a 26-day period. SMA with a 9-day period;
• Bollinger Bands: 20-day period;
• Non-commercial traders are speculators such as individual traders, hedge funds, and large institutions who use the futures market for speculative purposes and meet certain requirements;
• Long non-commercial positions represent the total number of long positions opened by non-commercial traders;
• Short non-commercial positions represent the total number of short positions opened by non-commercial traders;
• The non-commercial net position is the difference between short and long positions of non-commercial traders.