Analyzing Monday's trades:
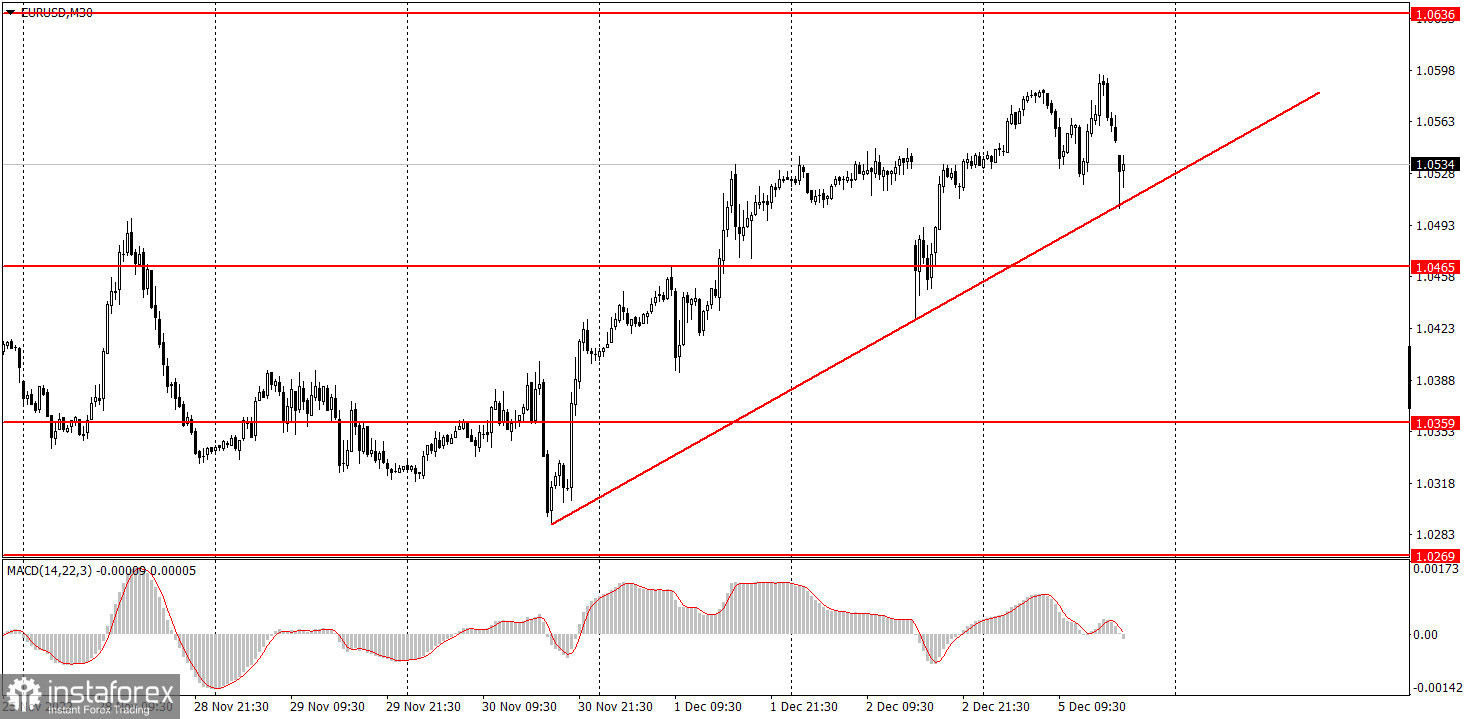
EUR/USD on 30M chart
EUR/USD showed turbulent and erratic movements on Monday. However, at least there were some reasons for that. Many different reports were scheduled in the European Union and in the US and there was also the speech of European Central Bank President Christine Lagarde. Looking ahead, Lagarde did not say anything interesting, but the reports on business activity in the service sectors of the US and EU were reflected in the charts. The eurozone business activities declined by 0.1 points in November, which is not much, by itself. Moreover, it was the second estimate for November, so market participants were ready for such a value. Nevertheless, the euro started to slightly fall after the report. And after the report on EU retail sales was released, which turned out to be disappointing, but generally matched the forecasts, the euro went on to fall further. Altogether, it lost about 40 points during this period. There seems to be a reaction, but it didn't matter. During the day, the pair repeatedly reversed without the influence of macroeconomic statistics.
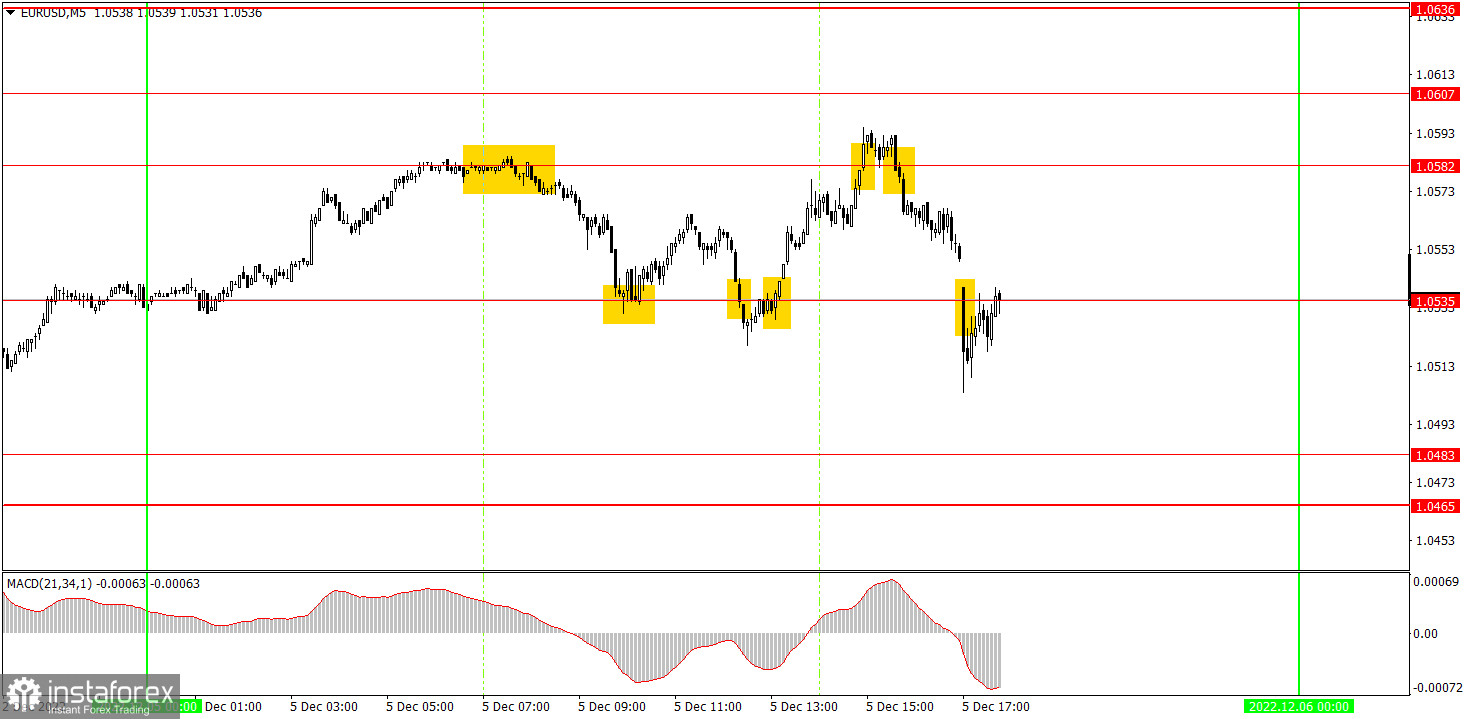
EUR/USD on M5 chart
There were good signals on Monday, although not all of them were profitable. In the beginning, the price rebounded from the level of 1.0582, then it fell to 1.0535 and rebounded from it. You could earn around 25 pips on this short position. You could have used the rebound from 1.0535, but you couldn't make profit on that since the euro did not reach the target level this time. But it managed to cross 1.0535, which was frankly a false signal (it was formed right after the release of the disappointing retail sales in the EU), and beginners received a small loss with it. You could use the next buy signal at 1.0535, because the second signal was false, but it had a mitigating circumstance in the form of the retail sales report. Whoever managed to work it out got a profit of about 20 pips. The next sell signal was formed during the US session, when EUR/USD settled below 1.0582, and it could bring profit of about 40 pips, because the pair fell below 1.0535. As a result, the day ended with a good profit, although the pair's movements were terrible.
Trading tips on Tuesday:
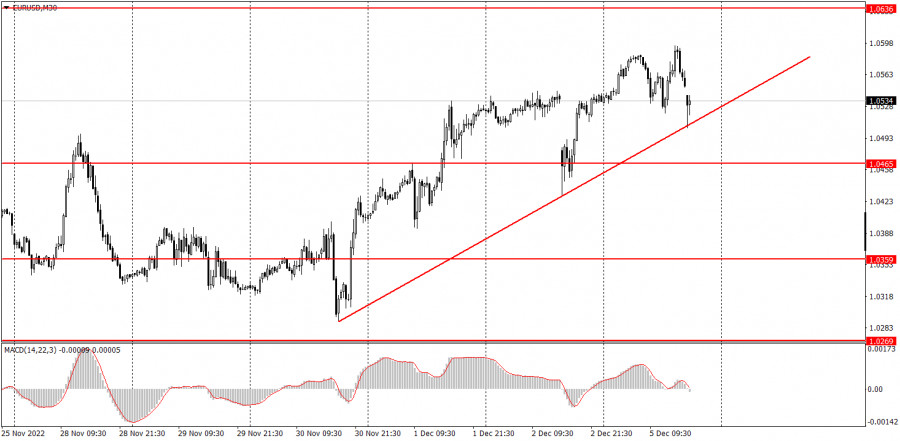
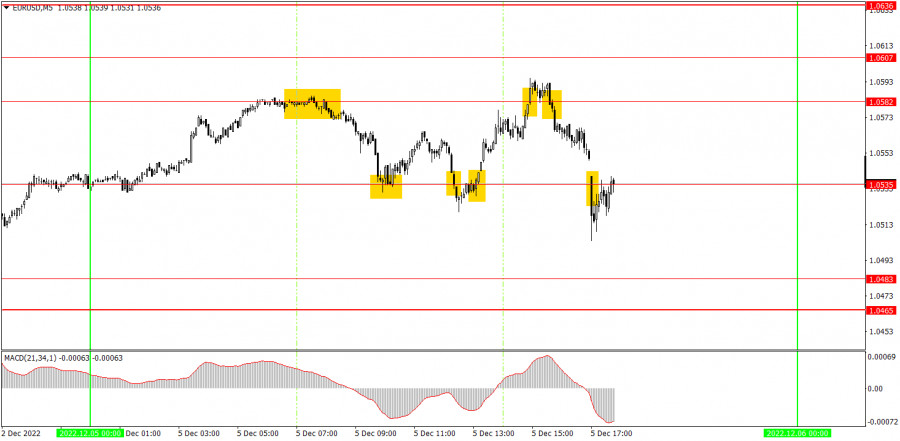
The pair is still gravitating towards growth on the 30-minute chart, it can't correct in any way, and a new ascending trend line has just formed. However, the problem is that with each new day there is less and less chance for the euro to continue rising, because it was, is and will be unreasonable. Nevertheless, settling below the trend line is a sign of a correction. On the 5-minute chart on Tuesday, it is recommended to trade at the levels of 1.0354, 1.0391, 1.0433, 1.0465-1.0483, 1.0535, 1.0582-1.0607, 1.0636, 1.0663, 1.0697. As soon as the price passes 15 pips in the right direction, you should set a Stop Loss to breakeven. No interesting events are scheduled for Tuesday in the EU and US. Traders wouldn't be able to react to anything.
Basic rules of the trading system:
1) The strength of the signal is determined by the time it took the signal to form (a rebound or a breakout of the level). The quicker it is formed, the stronger the signal is.
2) If two or more positions were opened near a certain level based on a false signal (which did not trigger a Take Profit or test the nearest target level), then all subsequent signals at this level should be ignored.
3) When trading flat, a pair can form multiple false signals or not form them at all. In any case, it is better to stop trading at the first sign of a flat movement.
4) Trades should be opened in the period between the start of the European session and the middle of the US trading hours when all positions must be closed manually.
5) You can trade using signals from the MACD indicator on the 30-minute time frame only amid strong volatility and a clear trend that should be confirmed by a trendline or a trend channel.
6) If two levels are located too close to each other (from 5 to 15 pips), they should be considered support and resistance levels.
On the chart:
Support and Resistance levels are the levels that serve as targets when buying or selling the pair. You can place Take Profit near these levels.
Red lines are channels or trend lines that display the current trend and show in which direction it is better to trade now.
The MACD indicator (14, 22, and 3) consists of a histogram and a signal line. When they cross, this is a signal to enter the market. It is recommended to use this indicator in combination with trend patterns (channels and trendlines).
Important announcements and economic reports that can be found on the economic calendar can seriously influence the trajectory of a currency pair. Therefore, at the time of their release, we recommend trading as carefully as possible or exiting the market in order to avoid sharp price fluctuations.
Beginners on Forex should remember that not every single trade has to be profitable. The development of a clear strategy and money management is the key to success in trading over a long period of time.