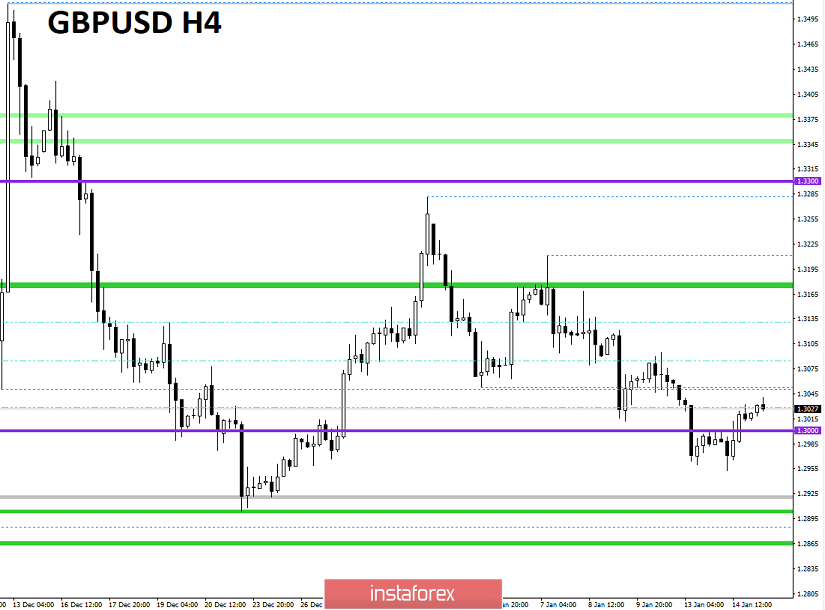
From the point of view of a comprehensive analysis, we see that a local breakdown of the psychological level of 1.3000 led to the temporary formation of stagnation within the level that was identified as a possible trade Breakdown / Rollback method, but as a result, the method was not confirmed. The most remarkable moment of this development was the previously voiced theory of the Zigzag-shaped model [03.12.19-14.01.20], which traced impulses due to its regularity. Therefore, a new impulse, which, in theory, should happen now, could lead the quotes to the area of 1.3122, which would reflect a section in the middle of a two-week move. The theory is actually interesting, and if it is confirmed, then we will see not just a characteristic lateral movement in the period of five weeks, but a kind of price contraction, which subsequently can lead to a sharp surge in activity.
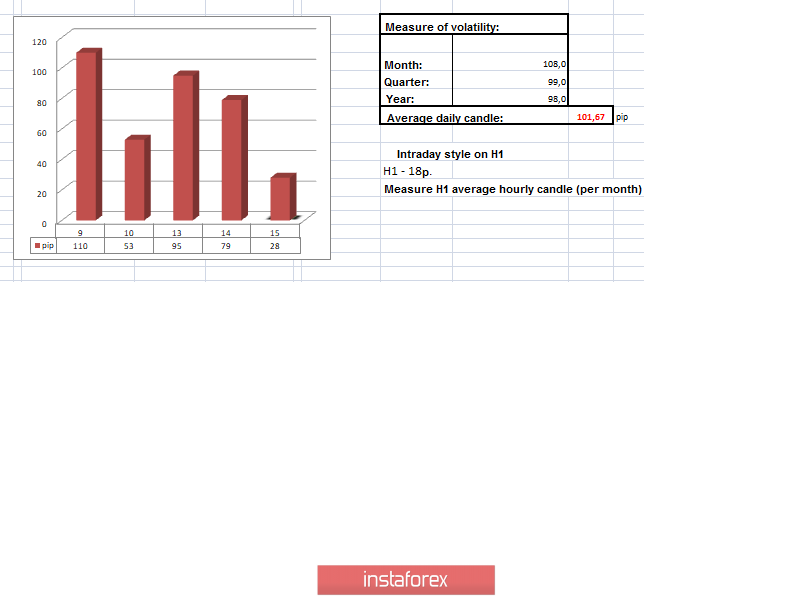
In terms of volatility, we have a slight decline of 21% relative to the average daily indicator, which does not have catastrophic consequences, and the rate of speculative operations is still high.
Analyzing the past minute by minute, we see stunning impulsive jumps throughout the day, which can be divided into periods 05:45-7:15 (Down); 7:15-10:45 (Up); 10:45-12:00 (Down); 12:00 -18:15 (Up) [Universal time on the trading terminal]. Now, subsequent fluctuation due to decreased activity led to the formation of a small pullback with transient stagnation. Among all the fluctuations, the most remarkable point was that the local minimum on January 13 [1.2960] was not broken by the quote, that is, the boundary of total accumulation was indicated.
As discussed in the previous review, traders continued to work down, having the remainder of the short positions. Top-up [opening a transaction in the same direction] from 1.2955 was not made due to the lack of a clear price fixing at this level. At the same time, from the point of view of speculative operations, it was possible to earn locally at price surges, as described above [TF, M15].
Considering the trading chart in general terms [the daily period], we see the very impressive upward trend [09/03/2019 - 12/12/19], which is in the structure of the global downward trend.
The news background of the past day contained data on inflation in the United States, where forecasts of its acceleration from 2.1% to 2.3% coincided. The reaction of the market to a rather important indicator was in terms of strengthening the US dollar, but due to expectations, the reaction took place even before the publication, and after that, the previously received profit was fixed.
In terms of the general information background, we have comments regarding the request for a referendum on the independence of Scotland. Thus, on Tuesday, the leader of the Scottish National Party Nicole Sturgeon sent a request to the head of the British government, in which there was a request to provide credentials for holding a referendum in Scotland. Meanwhile, Boris Johnson responded to this request quite quickly - with a refusal.
"The UK government will continue to support the democratic decision of the Scottish people and the promise you made to them. For this reason, I cannot agree to any request for a transfer of authority, which could lead to the next referendum on independence, "the text says on the website of the British government.
In turn, the first Minister of Scotland, Nicola Sturgeon was offended by London, tweeted that she considers the position of British Prime Minister Johnson unreasonable and destructive.
Today, in terms of the economic calendar, we have data on inflation in the United Kingdom, where changes are not expected, and its level will be 1.5%. In the afternoon, waiting for data on producer prices in the United States, where they forecast acceleration from 1.1% to 1.3%.
Further development
Analyzing the current trading chart, we see an attempt to maintain an upward mood, overcoming the peak of yesterday. In fact, the market, as well as the actions of its participants, is quite sluggish, which suggests that a flat may form just along the psychological level. In this case, the theory of the Zigzag-shaped model may be at risk of breaking the clock component and as a fact of a break in commercial interest.
In terms of the emotional component, there are prerequisites for the emergence of local jumps, which will lead to an increase in the activity of speculative positions.
By detailing the per-minute time span, we see that the quotes gradually moved up literally from the beginning of the day, but characteristic spikes occurred closer to the European trading session.
In turn, traders from a value of 1.3015 locally entered long positions having a small trading volume. At the same time, short positions are still being considered.
Having a general picture of actions, it is possible to assume that the development of quotes is possible according to two scenarios, where the first sets forth a Zigzag-shaped theory with a further upward movement towards 1.3122. The second theory is prone to retaining a large number of sellers who will concentrate on a psychological level.
Based on the above information, we derive trading recommendations:
- There are buy positions from a value of 1.305, where there is a conservative trading volume, and the prospect of a move in terms of steps is 1.3050 - 1.3100 --- 1.3122. It is necessary to carefully treat these operations, so the market can quickly turn around, thereby being prepared to liquidate positions.
- We consider selling positions after holding the quote below the psychological chart. Thus, it is advisable to fix at 1.2955 to enter a more worthwhile movement.
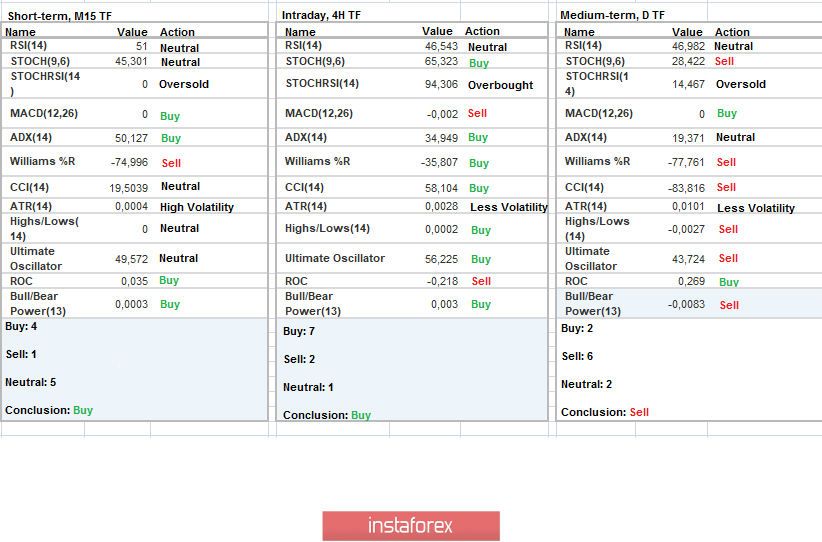
Indicator analysis
Analyzing a different sector of timeframes (TF), we see that indicators of technical instruments in the short-term and intraday periods signal a local upward interest. The medium term continues to hold downward interest.
Volatility per week / Measurement of volatility: Month; Quarter; Year
Measurement of volatility reflects the average daily fluctuation, calculated for the Month / Quarter / Year.
(January 15 was built taking into account the time of publication of the article)
The volatility of the current time is 28 points, which is still an extremely low indicator. It is likely to assume that if the quotation does go sideways, volatility will decrease by several times.
Key levels
Resistance zones: 1.3180 **; 1.3300 **; 1.3600; 1.3850; 1.4000 ***; 1.4350 **.
Support Areas: 1,3000; 1.2885 *; 1.2770 **; 1.2700 *; 1.2620; 1.2580 *; 1.2500 **; 1.2350 **; 1.2205 (+/- 10p.) *; 1.2150 **; 1,2000 ***; 1.1700; 1.1475 **.
* Periodic level
** Range Level
*** Psychological level
**** The article is built on the principle of conducting a transaction, with daily adjustment