From a comprehensive analysis, we see a long-awaited correction, the signs of which were noticed even before its implementation. Now, about the details. February was at the mercy of the bears, and this is confirmed by 13 trading days of decline. Overheating of short positions was noticed two weeks ago but special attention was paid to this phenomenon at the end of last week, where the quote locally approached the average level of the psychological range of 1.0700//1.0775//1.0850. I have reminded many times in my article about such a phenomenon as equilibrium, which should be present in any trend. Impulse/correction – this is the structure of a healthy trend. If we do not have the proper tact, we are faced with FOMO (lost profit syndrome), a phenomenon that is not stable and carries a temporary state of market participants.
Regarding the downward trend theory, we see that the correction has cooled the overheated sellers who were last at this stage on January 29-31. Now, we understand how significant the overheating was. I believe that there are no reasons for changing the mood even if the initial downward interest continues and the psychological ranges do not yet have a proper impact on market participants. Thus the development towards the levels of 1.0775-1.0700-1.0500-1.0350 is still possible in the medium term.
In terms of volatility, we see a real acceleration that we haven't seen for many days. It is likely to assume that the catalyst for the acceleration was just the same stable decline, during which there was an overheating of short positions and a surge in the activity.
Analyzing the past day by the minute, we see a characteristic symmetry, where activity came again at the beginning of the American trading session, as it was on the impulse of last Friday.
Friday: 16:30-17:15 (time on the trading terminal)
Monday: 16:00-17:00 (time on the trading terminal)
All this suggests an overflow of funds. It is necessary to analyze debt obligations as a basis for reflection.
As discussed in the previous review, medium-term traders follow a downward trend strategy, where the correction does not make changes to their plans but gives them new opportunities. At the same time, intraday traders, as well as speculators, worked relative to the existing levels, where the correction was in place.
Friday's trading recommendation generated revenue in terms of hitting the correction.
(Buy positions will be considered if the price is fixed higher than 1.0820, with the prospect of a move to 1.0850, local transaction)
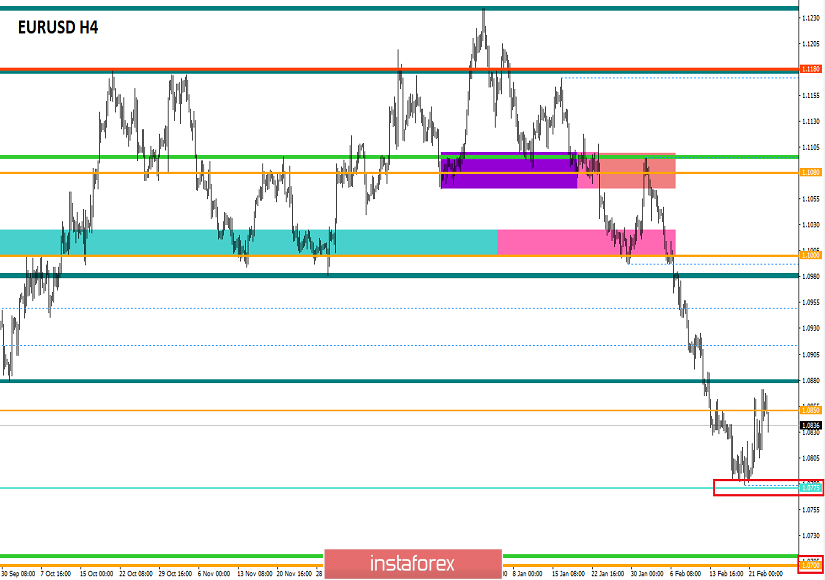
Looking at the trading chart in general terms (daily period), we see that the available fluctuation corresponds to the points of interaction of the price on the history in the period of 2017. The downward trend remains unchanged, and there are no signs of its change.
The news background of the past day had only the IFO business climate index in Germany, where the indicators came out better than forecasts. However, in this situation, I believe that there was a technical correction factor since there were no significant statistics for Europe and the United States.
In terms of general background information, we have a local panic on the subject of a possible rate cut by the Fed at the upcoming meeting. This kind of noise was raised yesterday when the futures contract for the rate changed dramatically. Now, with an 85% probability, the rate can be reduced by a quarter of a percent, according to the CME FedWatch tool.
The catalyst for this noise expressed in FedWatch was a sharp decline in the stock market and the risk of consequences of the coronavirus.
In turn, the topic raised last week regarding the emergency EU summit on the seven-year budget ended with nothing. The second day (February 21) also did not give the desired result.
"We need to finish everything by the end of the year, otherwise we will be left without a budget in 2021," said Ursula von der Leyen, head of the European Commission.
Let me remind you that the stumbling block was the hole in the budget due to the withdrawal of Britain from the EU community.
Today, in terms of the economic calendar, we have S&P / CS data on home prices in the United States, where growth is expected from 2.6% to 2.8%.
Further development
Analyzing the current trading chart, we see that the level of 1.0850, where the quote came during the correction, served as a point of resistance, slowing down buyers and forming a rebound from it. In fact, everything again resembles the dynamics of the past days, where there was an impulse, then a recovery. The point in the dilemma will be overcoming the area of 1.0815, where a variable support point was found earlier in the period. Regarding the medium-term course, everything is unchanged. The trend is downward and traders who focus on strategic positions know about it.
Detailing the available period by the minute, we can see that the activity came during the European session, where a downward move was set, which is still being held at the time of writing.
In turn, intraday traders are actively considering a return to short positions, but more confidence should come at the time of the breakdown of the area of 1.0818. Speculators are also interested in the current inertia, which makes it possible to enter positions locally. Medium-term traders are still in sales mode, not noticing the current correction.
It is likely to assume that the existing fluctuation can lead the quote to the slowdown area of 1.0815, where it is worth carefully monitoring the price-fixing points since the restoration of the original move is not far off.
Based on the above information, we will output trading recommendations:
- Buy positions will be considered if the price is fixed higher than 1.0875.
- Positions for sale are already held by medium-term traders. Intraday traders are waiting for a breakdown of the area of 1.0815. Speculators are already in short positions in the direction of 1.0820.
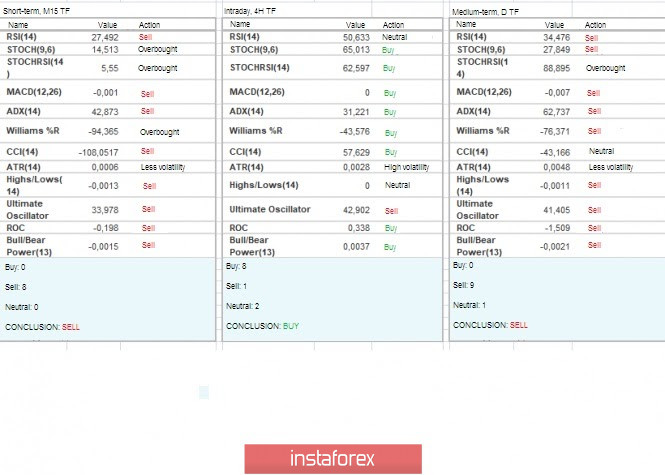
Indicator analysis
Analyzing different sectors of timeframes (TF), we see that the indicators of technical instruments have a variable buy signal within the hourly periods due to the recent correction. In turn, daily intervals invariably signal sales.
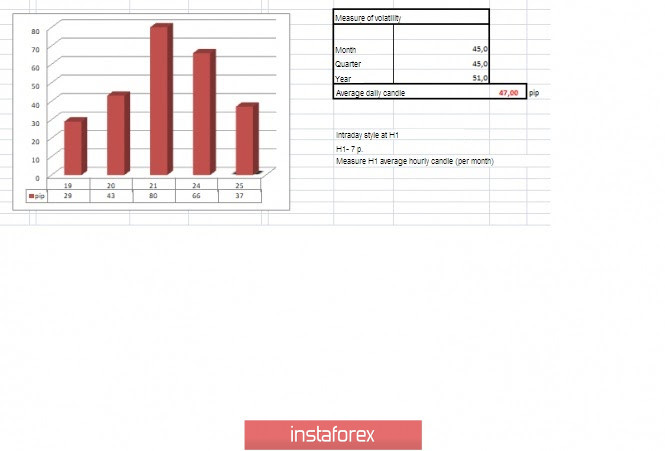
Volatility for the week / Volatility Measurement: Month; Quarter; Year.
The volatility measurement reflects the average daily fluctuation from the calculation for the Month / Quarter / Year.
(February 25 was based on the time of publication of the article)
The volatility of the current time is 37 points, which is already within the normal range for this section of time, but even lower than the daily average. It is likely to assume that if the current mood is maintained, volatility may still reach and exceed the daily average.
Key levels
Resistance zones: 1.0850**; 1.0850**; 1.0879*; 1.0900/1.0950**; 1.1000***; 1.1080**; 1.1180; 1.1300**; 1.1450; 1.1550; 1.1650*; 1.1720**; 1.1850**; 1.2100
Support zones: 1.0775*; 1.0700; 1.0500***; 1.0350**; 1.0000***.
* Periodic level
** Range level
*** Psychological level
***** The article is based on the principle of conducting a transaction, with daily adjustments.