From a comprehensive analysis, we see a recovery process that did not take long. And now about the details. The technical correction that occurred when the variable support of 1.0775 was detected led the quote to the area of 1.0925, where there were a slowdown and partial recovery. In fact, it is already clear that we had a local movement and a return of the price to the level of 1.0775, at this point in time.
Based on this logic, traders moved to theories, so analyzing the daily periods, in particular inertial fluctuations, there was a similarity with the rally. The theory is that the turn of the downward course is the first stage, after which there will be a more significant acceleration, overcoming the level of 1.0775 and a minimum of 1.0636 on the way. In all this, the negative external background and the consequences of the COVID-19 virus on the world economy will contribute to the development, where the dollar will become a kind of protective asset.
Analyzing the last trading day, we see that the round of long positions appeared during the Pacific-Asian session, but the main jumps occurred at the start of the Europeans. The maximum correction point is 1.0925, and the recovery relative to the correction occurred during the American session.
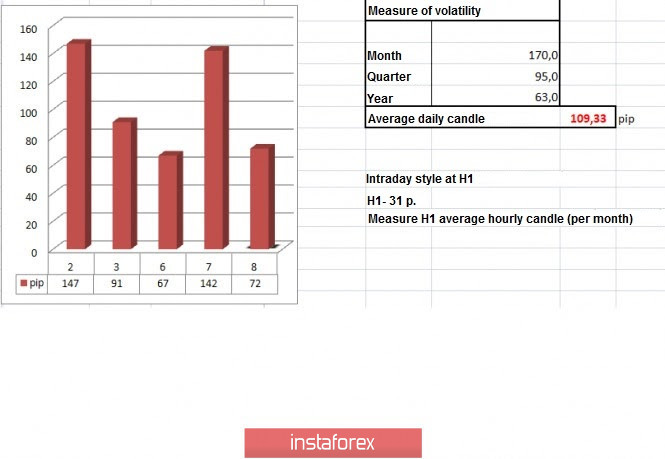
In terms of volatility, we see that the slowdown of the past two days was not in vain, as the acceleration resumed exceeding the daily average by 30%.
Details of volatility: Monday-155 points; Tuesday-183 points; Wednesday-115 points; Thursday-278 points; Friday-166 points; Monday-151 points; Tuesday-234 points; Wednesday-243 points; Thursday-326 points; Friday-194 points; Monday-191 points; Tuesday-160 points; Wednesday-133 points; Thursday-188 points; Friday-194 points; Monday-134 points; Tuesday-127 points; Wednesday-136 points; Thursday-147 points; Friday-91 points; Monday-67 points; Tuesday-142 points. The average daily indicator, relative to the dynamics of volatility is 109 points (see the table of volatility at the end of the article).
As discussed in the previous review, traders went into profit for two reasons at once. First is to buy, where they considered the move from 1.0900 to 1.0920, and then to sell, but at a new trading day.
Looking at the trading chart in general terms (the daily period), we see a global downward trend, where five inertial fluctuations have been formed over the last three months.
The news background of the past day had data on industrial production in Germany, where the rate of decline accelerated from -0.9% to -1.2% and it is worth noting this for February. What is waiting for us in March? – further collapse.
In terms of the general information background, we see that while the COVID-19 virus continues to set anti-records for the number of infected in the world, the European Central Bank (ECB) is considering expanding and extending the program of stimulus measures. So during a video conference that lasted as much as 16 hours between Germany, the Netherlands and other European countries, EU support measures worth 500 billion euros were considered. It is worth noting that the Finance Ministers of the eurozone do not exclude that to combat the effects of the coronavirus, they may need a much larger injection, or rather fiscal measures worth up to 1.5 trillion euros.
From the West, where the situation with the virus is not better, the former head of the Federal Reserve System (FRS) Ben Bernanke, who believes that the rapid recovery of the economy from the pandemic is not worth waiting for, but a repeat of the great depression in 12 years, is also not worth waiting for.
"I do not believe that there will be a rapid recovery of the American economy. We will probably have to revive activity in stages, after which it may be followed by periods of a new slowdown," said the former head of the Fed.
Overall, Bernanke sees the economy of the United States declining by about 30% this quarter due to measures to contain and combat the COVID-19 virus, and it may take several years for the economy to recover all its positions.
In simple words, 2020 will not be an easy year, and this one concerns not only the United States.
Today, there is no flow of statistical data in terms of the economic calendar, but there is a publication of the minutes of the Federal Reserve meeting, where traders will be fed up to see the details of monetary policy and plan to reduce the interest rate.
Further development
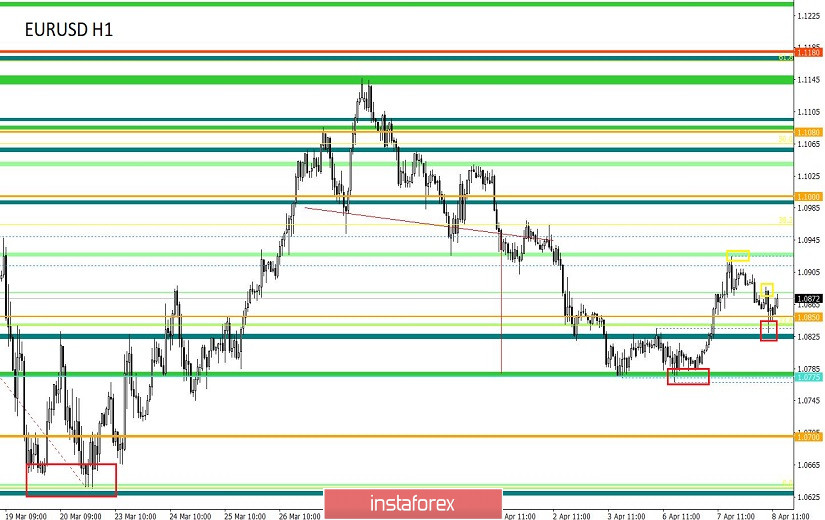
Analyzing the current trading chart, we see a return of the quote to the area of 1.0850, where it felt variable support and turned around locally. In fact, the characteristic indecision in actions is still felt among intraday traders, where only speculators who ride on local impulses feel good. Now the most important thing is not to omit the moment, since the recovery has this kind of platform, regarding which there will be a main breakthrough. Our main position is aimed at lowering, but there is no hurry, so we will consider the step move. Will there be an alternative in this story? Perhaps, but local.
Analyzing the minute-by-minute period, that short positions were viewed during the Pacific and Asian sessions, but the main race occurred at 9:00, that is, already on the Europeans.
We can assume that the first entry into short positions will occur below the level of 1.0850, more specifically below the current jump of 1.0830. The prospect, in this case, is around 1.0775. However, the next stage is the local minimum of 1.0636, so if we overcome it, there will be a major turn, where the historical lows may fall.
An alternative scenario is considered as a local move, where the reference point is 1.0890, towards 1.0920.
Indicator analysis
Analyzing different sectors of timeframes (TF), we see that due to the fact that the quote is still wagging within the correction, the indicators of technical instruments on the minute and hour periods signal a purchase. At the same time, the daily sections reflect an earlier inertia move, signaling a sale.
Volatility for the week / Measurement of volatility: Month; Quarter; Year.
Measurement of volatility reflects the average daily fluctuation from the calculation for the Month / Quarter / Year.
(April 8 was based on the time of publication of the article)
The volatility of the current time is 72 points, which is still considered a low indicator of activity. It is likely to assume that if the quote manages to break out of the recovery cycle, the volatility may accelerate by at least two times.
Key levels
Resistance zones: 1.1000***; 1.1080**; 1.1180; 1.1300; 1.1440; 1.1550; 1.1650*; 1.1720**; 1.1850**; 1.2100.
Support zones: 1.0850**; 1.0775*; 1.0650 (1.0636); 1.0500***; 1.0350**; 1.0000***.
* Periodic level
** Range level
*** Psychological level