From the point of view of a comprehensive analysis, you can see the accumulation process, which has been taking place for more than 30 hours on the market, and now let's talk about the details.
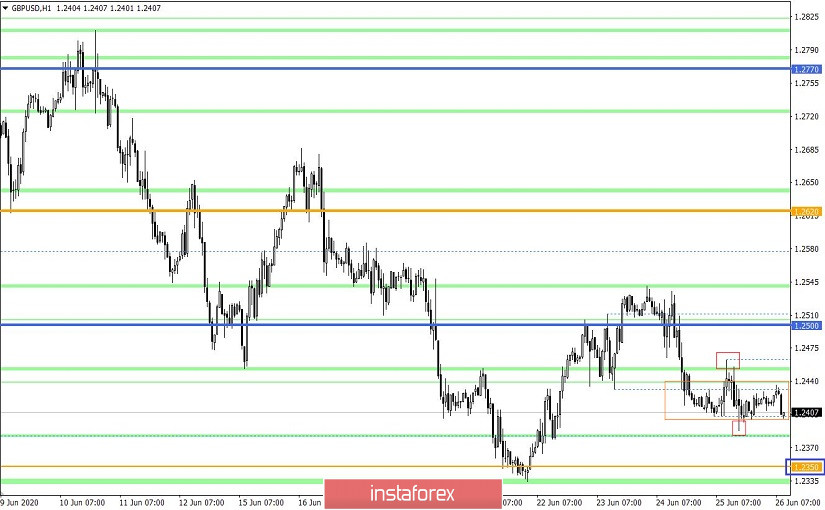
The trading week is coming to an end and thus, it's time to sum up the preliminary results. The main technical model of the past days was a correction that appeared on Monday from the mirror level of 1.2350 and extended to the area of 1.2500/1.2540. The subsequent oscillation occurred in the form of a recovery process, on the basis of which it was possible to work out about 73% of the correction by Thursday, where a variable stop occurred within the coordinate 1.2400.
The desire of sellers to keep the available measure from the range of 1.2770 deserves respect, but nothing will change until the quote is below 1.2330, which will start the process of further movement in the structure of the range 1.2150//1.2350//1.2620.
Regarding theories of market development, as before, they strictly follow the downward course. This is understandable, the trend as it was and remains "bearish". It is worth considering only one thing, this year is very volatile, which means that the emotional component of the market is knocked down, which leads to the actions of speculators.
Analyzing the past trading day by minute, you can fix a round of short positions, which reappeared from 11:00 UTC+00, as the day before, but in this case, it lasted only a few hours, until 13:30 UTC+00, where the minimum of 1.2388 was formed. The general dynamics, as before, has a lateral mood, which first appeared on Wednesday, having a variable amplitude within 1.2405/1.2435 and a maximum of 1.2388/1.2463.
In terms of volatility, a slowdown of 40% is recorded relative to the average daily indicator, which may seem like stabilization of market interest, but this is not so. The speculative excitement as it was and remains on the market, which means that a variable stop in the form of accumulation can play the role of a catalyst for trading forces, which will ultimately lead to a new round of acceleration. It is worth recalling that June has been the second most volatile since the beginning of the year.
As discussed in the previous review, the main strategy was a decline towards the level of 1.2350, where an attempt to develop was, but still remains relevant.
Considering the trading chart in general terms (daily period), you can see that the minimum has been updated four times over the past five years, but since the end of 2016, the quote has kept a conditionally side price movement.
The news background of the past day contained the final data on the United States GDP for the first quarter, where the forecasts were confirmed and the economy contracted by 5.0%, which became even worse than the preliminary estimate. The reaction to the indicator was not so pronounced, since the market was ready for sad results, thus the data were already taken into account in the quote.
Investors were pleased with the data on orders for durable goods in the United States, which, instead of 8.5% growth, showed a jump of as much as 15.8% in May, which was the most impressive growth since July 2014. Do not forget that in the previous two months, orders showed a sharp decline due to the coronavirus pandemic.
In terms of the general informational background, we see a different side of the recent negotiations between Britain and Brussels regarding relations after Brexit. So, everything is clearly understood, the loud statements of Prime Minister Boris Johnson on the success of his personal participation in the negotiations and even called the dates for a possible deal until the end of July. On this occasion, President of the European Parliament, David Sassoli, spoke out, who accused Johnson of not wanting to compromise in the negotiations on the Brexit deal and urged the party to think about extending the transition period.
"We are very worried because we don't see much enthusiasm on the part of the British authorities and we don't see a strong will to reach an agreement that would satisfy all parties, this puts us in a situation in which we are frankly a little worried at the moment" - said David Sassoli.
Today, in terms of the economic calendar, we only have data on personal income and expenditure in the United States, which are unlikely to put strong pressure on the market. Thus, it is worth continuing to observe the external background, as well as the flow of speculative positions.
The upcoming trading week in terms of the economic calendar is full of statistics. The show begins with the UK lending market, as well as the final data on the UK's GDP. Wednesday and Thursday is dedicated to the United States, which will publish the ADP report, the report of the Department of Labor, as well as the minutes of the meeting of the Federal Reserve.
The most interesting events displayed below (Universal Time) --->
Monday, June 29th
Bank of England consumer lending in May
May mortgage lending
USA 14:00 - The index of incomplete sales in the real estate market for May
Tuesday, June 30th
Great Britain 06:00 - GDP for the first quarter
USA 13:00 - Composite housing price index S & P / CS Composite-20 seasonally adjusted for April
Wednesday, July 1
Great Britain 8:30 - Manufacturing PMI for June
USA 12:15 - ADP Report on the level of employment in the private sector for June
USA 14:00 - Manufacturing PMI from ISM in June
USA 18:00 - Protocol of the meeting of the Federal Open Market Committee
Thursday, July 2
USA 12:30 - report to the US Department of Labor
- Change in the number of people employed in the non-agricultural sector
- Unemployment rate
- Average hourly wage
USA 12:30 - Applications for unemployment benefits
Friday, July 3
USA (WEEKEND DAY) - Independence Day
Further development
Analyzing the current trading chart, we can see that the price movement is based on a variable side range of 1.2400/1.2450, for more than 30 hours, where market participants consider the current situation as a kind of accumulation process, which can lead to acceleration. The main support level is still the mirror level of 1.2350, to which most market participants are oriented.
It can be assumed that the price fluctuation in the range of 1.2400/1.2450 will end soon, where the downward trend will most likely bring the quote to the area of 1.2330/1.2350, which will be considered a complete recovery, as well as a signal for further development in range 1.2150 // 1.2350 // 1.2620.
Based on the above information, we derive trading recommendations:
- Consider sell trades below the level of 1.2400, with the prospect of a move to 1.2350
- Consider buy trades as local operations in case of price consolidation above 1.2460, towards 1.2500.
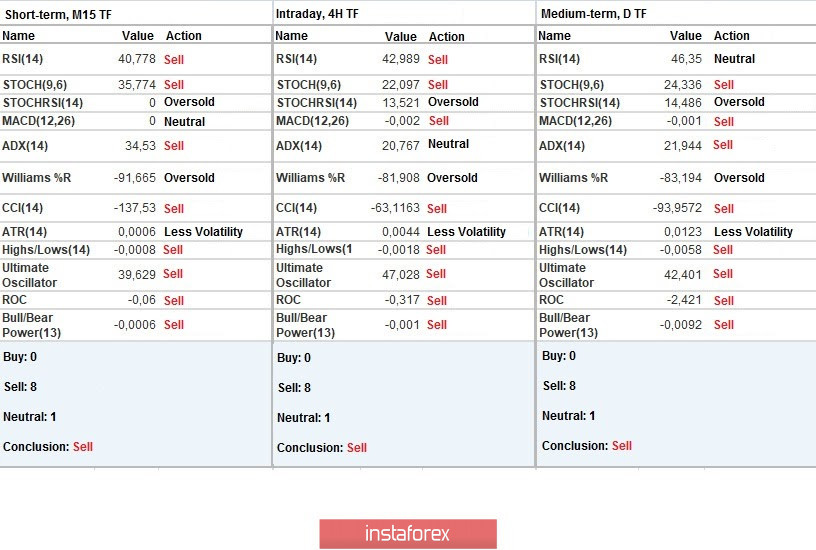
Indicator analysis
Analyzing a different sector of time frames (TF), we see that the indicators of technical instruments on hourly and daily periods signal sales, indicating the prevailing downward interest in the market. In turn, minute intervals running in the range also signal a sale.
Volatility per week / Measurement of volatility: Month; Quarter; Year
Measurement of volatility reflects the average daily fluctuation, calculated for the Month / Quarter / Year.
(June 26 was built taking into account the time of publication of the article)
The volatility of the current time is 37 points, which is another 56% lower than the daily average. It can be assumed that the accumulation process will lead to a new round of acceleration, which will affect volatility.
Key levels
Resistance Zones: 1.2500; 1.2620; 1.2770 **; 1.2885 *; 1.3000; 1.3170 **; 1.3300 **; 1.3600; 1.3850; 1.4000 ***; 1.4350 **.
Support Zones: 1.2350 **; 1.2250; 1.2150 **; 1.2000 *** (1.1957); 1.1850; 1.1660; 1.1450 (1.1411); 1.1300; 1.1000; 1.0800; 1.0500; 1.0000.
* Periodic level
** Range Level
*** Psychological level
**** The article is built on the principle of conducting a transaction, with daily adjustment