empty
 
 
11.01.2022 09:06 PM
Technical analysis of GBP/USD for January 11, 2022

This image is no longer relevant

Overview :
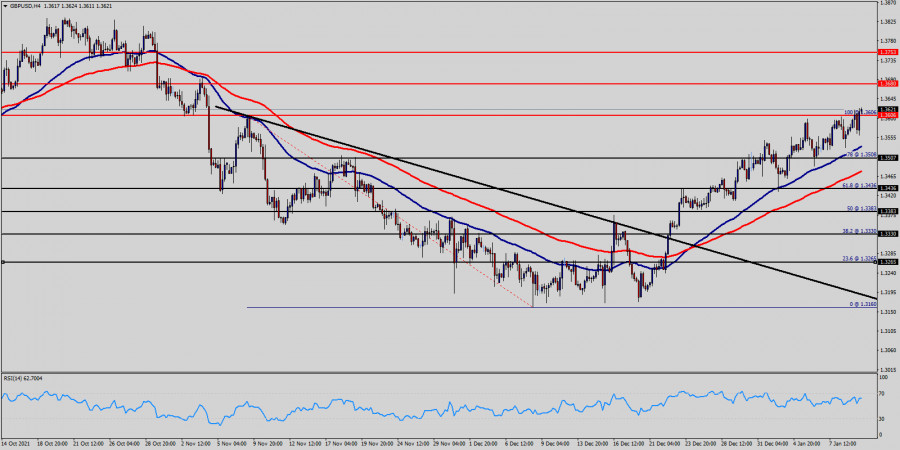
  • The GBP/USD pair continues to move upwards from the level of 1.3507.
  • According to the previous events, the GBP/USD pair is still moving between the levels of 1.3507 and 1.3680; for that we expect a range of 173 pips (1.3680 - 1.3507).
  • On the four-hour chart, immediate support level is seen at 1.3507, which coincides with a ratio of 78% Fibonacci retracement.
  • Currently, the price is moving in a bullish channel. This is confirmed by the RSI indicator signaling that we are still in a bullish trending market.
  • The price is still above the moving average (100) and (50). Therefore, if the trend is able to break out through the first resistance level of 1.3604, we should see the pair climbing towards the daily resistance at 1.3680 to test it.
  • It would also be wise to consider where to place stop loss; this should be set below the second support of 1.3507.

Signal :

  • Buy above the spot of 1.3604 with the targets 1.3680 and 1.3735.
  • On the other hand, the daily strong support is seen at 1.3507.
  • If the GBP/USD pair is able to break out the level of 1.3507, the market will decline further to 1.3436.
GBPUSD
Great Britain Pound vs US Dollar
Select timeframe
5
min
15
min
30
min
1
hour
4
hours
1
day
1
week
Start trade
Start trade
  • Grand Choice
    Contest by
    InstaForex
    InstaForex always strives to help you
    fulfill your biggest dreams.
    เข้าร่วมการแข่งขัน
  • Chancy Deposit
    ฝากเงินในบัญชีของคุณใน $3,000 และรับ $8000 ไปเพิ่ม!
    ใน มีนาคม ทางเราได้ออก$8000 ภายในแคมเปญ Chancy Deposit !
    คว้าโอกาสที่จะชนะด้วยการฝากเงิน $3,000 ไปในบัญชีเทรด เมื่อทำตามเงื่อนไขนี้แล้ว คุณก็จะกลายเป็นผู้เข้าร่วมแคมเปญ
    เข้าร่วมการแข่งขัน
  • เทรดให้ดีแล้วคว้ารางวัล
    เติมเงินในบัญชีของคุณอย่างน้อย $500 สมัครเข้าร่วมการแข่งขัน และลุ้นรับรางวัลอุปกรณ์ติดต่อสื่อสารแบบพกพา
    เข้าร่วมการแข่งขัน
  • โบนัส 100%
    โอกาสพิเศษของคุณในการรับโบนัส 100% จากเงินฝากของคุณ
    รับโบนัส
  • โบนัส 55%
    สมัครรับโบนัส 55% สำหรับการฝากทุกครั้ง
    รับโบนัส
  • โบนัส 30%
    รับโบนัส 30% ทุกครั้งที่คุณเติมเงินในบัญชีของคุณ
    รับโบนัส

Recommended Stories

GBP/USD. Analysis for March 20, 2023

The wave analysis for the pound/dollar pair now appears to be challenging but does not call for any clarifications. The wave patterns for the euro and the pound differ somewhat

Chin Zhao 18:00 2023-03-20 UTC+2

EUR/USD. Analysis for March 20, 2023

The wave analysis on the 4-hour chart for the euro/dollar pair becomes confused as the euro rises. We saw a sharp decrease in quotes last week, which may be seen

Chin Zhao 17:43 2023-03-20 UTC+2

Elliott wave analysis of EUR/JPY for March 20, 2023

EUR/JPY finally broke below the flag support line and should continue lower towards our long-term target near 133.55, with the first hurdle seen near the former low at 137.47. Short-term

Torben Melsted 06:09 2023-03-20 UTC+2

Elliott wave analysis of EUR/USD for March 20, 2023

EUR/USD is in a position where we have two possible scenarios. We could have seen the low of wave 4 with the failure spike down to 1.0542, our preferred count

Torben Melsted 06:02 2023-03-20 UTC+2

GBP/USD. Analysis for March 16, 2023

The wave analysis for the pound/dollar pair now appears to be challenging, but it does not call for any clarifications. The wave patterns for the euro and the pound differ

Chin Zhao 18:40 2023-03-16 UTC+2

EUR/USD. Analysis for March 16, 2023

The 4-hour chart for the euro/dollar pair still shows the same wave pattern, which is excellent because it allows us to predict how the situation will develop. It's also encouraging

Chin Zhao 18:19 2023-03-16 UTC+2

Elliott wave analysis of GBP/JPY for March 16, 2023

We expect GBP/JPY to continue the downside pressure and a break below support near 159.20 for a decline towards the 145.76 target. Short-term we see resistance 161.29 that we expect

Torben Melsted 07:52 2023-03-16 UTC+2

Elliott wave analysis of EUR/JPY for March 16, 2023

EUR/JPY is testing the flag support line and is likely to break below this support line soon to confirm the next part of the downside correction towards the 137.47 target

Torben Melsted 07:48 2023-03-16 UTC+2

EUR/USD. Analysis for March 15, 2023

The 4-hour chart for the euro/dollar pair still shows the same wave pattern, which is excellent because it allows us to predict how the situation will develop. It's also encouraging

Chin Zhao 17:23 2023-03-15 UTC+2

Elliott wave analysis of NZD/USD for March 15, 2023

NZD/USD is ready for the next impulsive advance towards at least 0.7706 and possibly even closer to 0.8214. Our best interpretation of the rally since the 2000 low at 0.3985

Torben Melsted 06:20 2023-03-15 UTC+2
หากไม่สะดวกคุยในตอนนี้
ระบุคำถามไว้ได้ใน แชท.