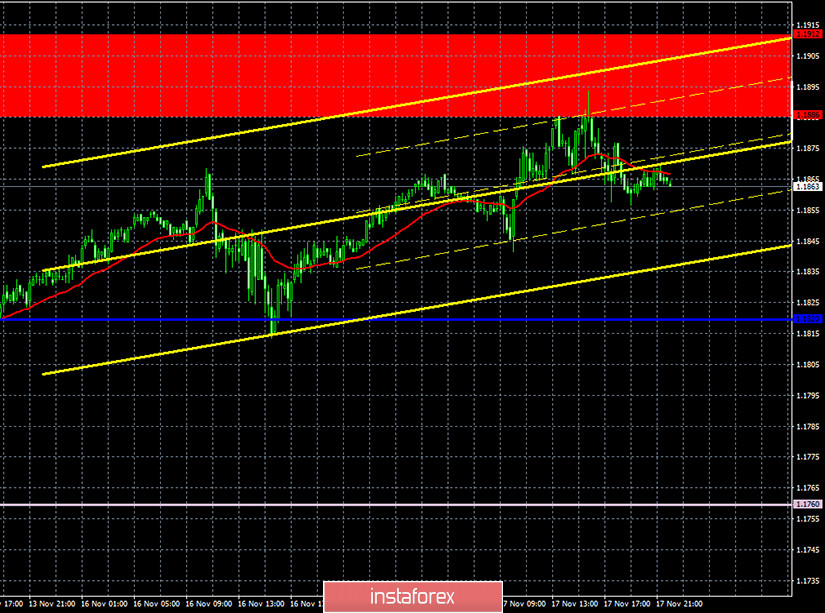
EUR/USD 1H
The euro/dollar pair moved up on the hourly timeframe on Tuesday, November 17, in line with the general upward trend that has developed in recent days. An upward trend line signals the preservation of the upward sentiment, therefore the recommendations were to trade upward. Yesterday, traders managed to reach the first target for buy positions - the resistance area of 1.1886-1.1912. It was not possible to overcome it, so now the probability of the pair's downward reversal is increasing, this is where the price settles below the trend line and shows the beginning of a new downward trend inside the 1.1700-1.1900 horizontal channel, within which the pair has been trading for more than three months. At the same time, buyers leave behind excellent chances for further advancement, at least to the previous local high near the 1.2000 level. To do this, you just need to overcome the 1.1886-1.1912 area. Well, sellers can only wait for the price to settle below the trend line, then they can count on the pair to fall by 100-150 points to the lower border of the horizontal channel.
EUR/USD 15M
Both linear regression channels are directed to the upside on the 15-minute timeframe. Therefore, not overcoming the Kijun-sen line made it possible for traders to maintain the upward trend in the short term. And overcoming the 1.1886-1.1912 area may further strengthen the bulls' position in the market and allow them to continue pushing the pair further up.
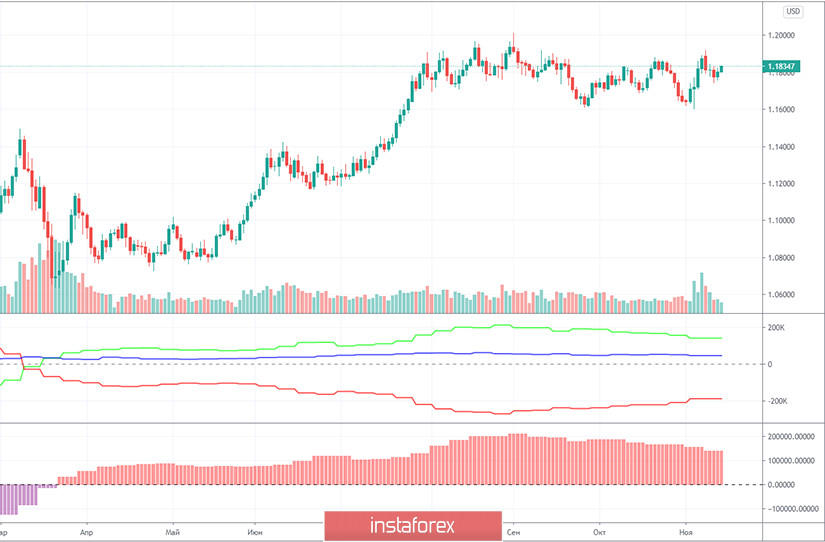
COT report

The EUR/USD pair increased by 170 points in the last reporting week (November 3-9). The US presidential elections provoked a rather strong drop in the US currency, however, it lasted no more than a few days. Nevertheless, the euro rose in price, and market participants can expect that professional traders are leaning towards being bullish. However, the latest Commitment of Traders (COT) report showed that the mood of large traders has become more bearish. The net position of the "non-commercial" group of traders decreased again, this time by 17,000 contracts, which is quite a lot. Recall that non-commercial traders have been reducing their net position for several consecutive weeks, which is eloquently signaled by the lower indicator in the chart. A decrease in the net position, in fact, means that Buy-contracts (longs) are closed and Sell-contracts (shorts) are opened. The first professional traders closed 9,200 during the reporting week, and the second - opened 7,800. However, despite the fact that the net position of non-commercial traders has been falling since the beginning of September, the downward trend has still not started for the EUR/USD pair. The green and red lines on the first indicator continue to move towards each other, which means that the trend has already begun long ago. However, there is actually no downward movement in the long term. Therefore, based on the latest COT report, we can say the following: our forecasts remain the same, since the report data allows only such conclusions to be drawn. We still believe that the upward trend has ended at around 1.2000.
No important macroeconomic reports for the European Union on Tuesday. European Central Bank President Christine Lagarde spoke in the evening, but recently she has been speaking almost every day, as scheduled. She did not mention anything important. In addition, the US released its retail sales report for October. It is easy to guess that this report turned out to be worse than the forecast values, since the dollar could not rise after it was released. Retail sales were up just 0.3% m/m, while the retail control group was up 0.1% m/m. Retail sales excluding cars by 0.2%. US industrial production did not necessarily disappoint, as it practically coincided with the forecasts of experts at +1.1% m/m. However, macroeconomic statistics still did not support the dollar on Tuesday.
The EU will publish its inflation report for October on Wednesday, which does not bode well for the euro. Most likely, the consumer price index will remain at its lowest, negative value of -0.3% y/y. This is an unprecedentedly low value of the indicator and is unlikely to trigger purchases of the euro. On the other hand, the euro does not really need the support of the fundamental background now. The currency rises in price without it, however, so far only within the horizontal channel. At this time, it seems that only a serious worsening of the political crisis in the United States (either epidemiological or geopolitical) could get the price to settle above the 1.1900 level and open up additional prospects for buyers.
We have two trading ideas for November 18:
1) Buyers continue to keep the pair above the Kijun-sen line (1.1820), as well as above the upward trend line. However, there was a rebound from the support area of 1.1886-1.1912, so you are advised to open long positions while aiming for the resistance level of 1.2007 if this area is overcome. Take Profit in this case will be up to 70 points.
2) Bears are still in the shadow of bulls. Therefore, in order to be able to open sell orders while aiming for the Senkou Span B line (1.1760) and the support area of 1.1692-1.1699, the price must settle below the trend line and overcome the Kijun-sen line (1.1820). Take Profit in this case can range from 40 to 100 points.
Hot forecast and trading signals for GBP/USD
Explanations for illustrations:
Support and Resistance Levels are the levels that serve as targets when buying or selling the pair. You can place Take Profit near these levels.
Kijun-sen and Senkou Span B lines are lines of the Ichimoku indicator transferred to the hourly timeframe from the 4-hour one.
Support and resistance areas are areas from which the price has repeatedly rebounded off.
Yellow lines are trend lines, trend channels and any other technical patterns.
Indicator 1 on the COT charts is the size of the net position of each category of traders.
Indicator 2 on the COT charts is the size of the net position for the "non-commercial" group.