Here are the details of the economic calendar for October 21:
The United States published its weekly data on applications for unemployment benefits yesterday, where their volume declined.
Details of statistics:
The volume of initial applications for benefits declined from 296 thousand to 290 thousand, with a growth forecast of up to 300 thousand.
The volume of repeated applications for benefits declined from 2,603 thousand to 2,481 thousand, with a forecast of 2,550 thousand.
Statistical data on the US labor market had a positive impact on dollar positions.
* Applications for unemployment benefits reflect the number of currently unemployed citizens and those receiving unemployment benefits. This indicator is considered to be the state of the labor market, where the growth of the indicator negatively affects the level of consumption and economic growth. The reduction of applications for benefits has a positive effect on the labor market.
Analysis of trading charts from October 21:
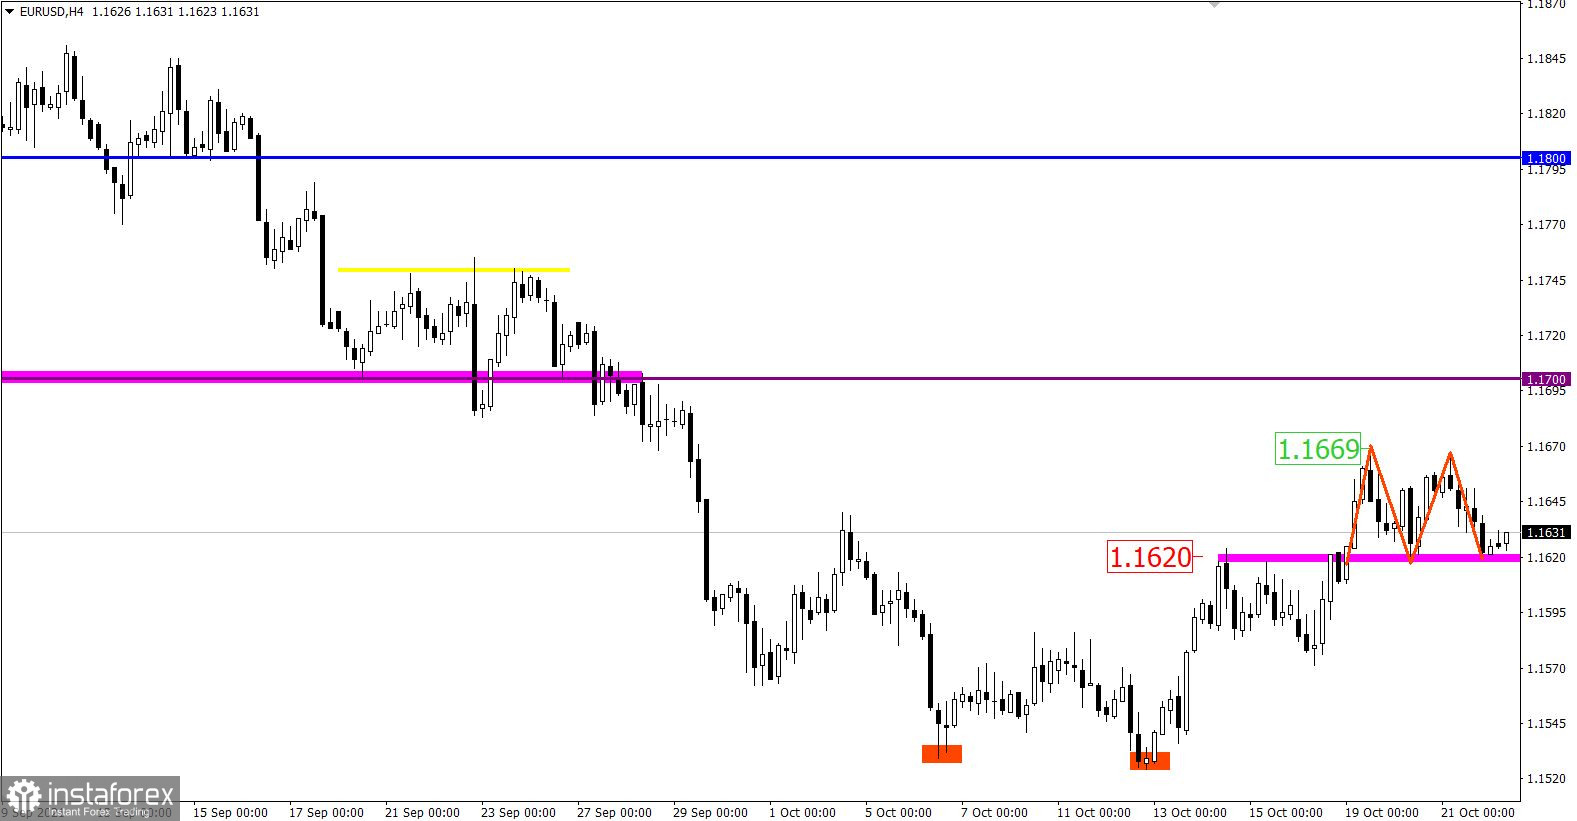
The EUR/USD pair formed a stagnation in the form of a fairly wide amplitude of 1.1620/1.1669 at the peak of the corrective course. This movement may signal a slowdown in the upward trend. From the point of view of graphical analysis, the amplitude move is called "Double Top", which signals a change in movement from an upward to a downward one.
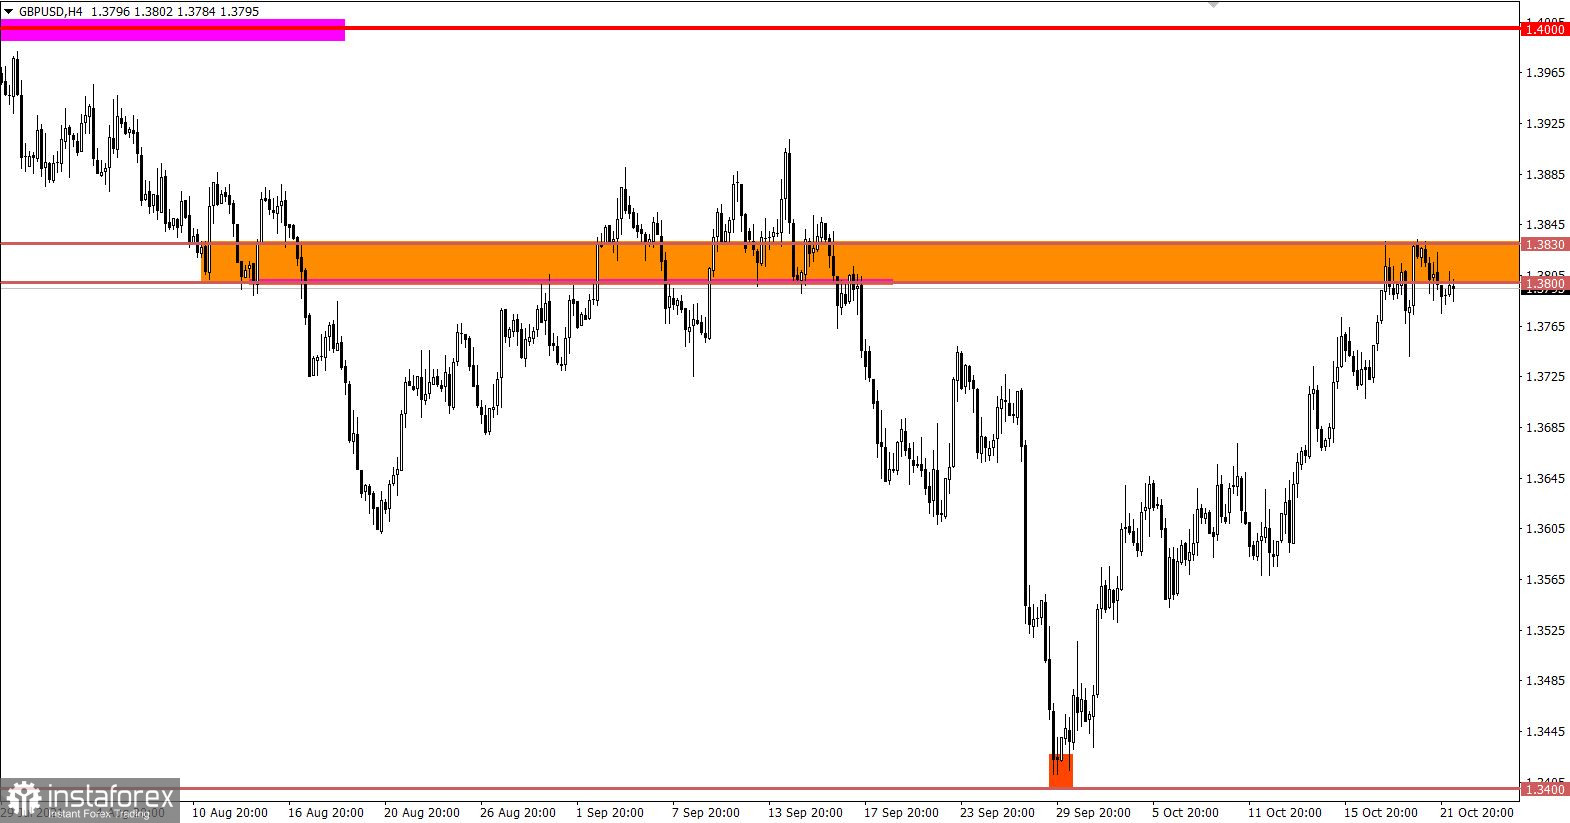
The GBP/USD pair has slowed down the formation of a correctional course in the resistance area of 1.3800/1.3830. This led to a reduction in the volume of long positions and price stagnation along the resistance area.
Considering the correction scale of more than 400 points from the support point of 1.3400, it can be assumed that the positions on the pound are overheated. This may indicate a gradual reversal of the price.
* Graphical analysis is a type of technical analysis that studies price charts, identifying repetitive patterns on them, which are called graphical models. In our case, there is an assumption of the formation of the "Double vertex" model. A figure of this type does not guarantee a price reversal but may indicate a regrouping of trading forces, which will eventually lead to a new round of activity in the market.
Long positions or Long means buy positions.
October 22 economic calendar:
This morning, the UK's retail sales data were published, which turned out to be terrible. In any case, nothing good was expected from retail sales, their level of zero growth was supposed to be replaced by a decline of 0.4%. As a result, a decline of 1.3% was recorded in annual terms, and monthly indicators, which were supposed to show an increase of 0.5%, fell by 0.2%.
The pound sterling is shocked, but this will strengthen the downward interest.
The preliminary data on business activity in Europe, Great Britain, and the United States for October will be released today.
Details of statistics:
8:00 Universal time - The index of business activity in the services sector in Europe: Prev. 56.4 pips; The forecast is 55.5 points.
8:00 Universal time - The index of business activity in the manufacturing sector in Europe: Prev. 58.6 pips; Forecast 57.0 points.
8:30 Universal time - Business activity in the UK services sector: Prev. 55.4 pips; Forecast 54.5 points.
8:30 Universal time - PMI in the UK manufacturing sector: Prev. 57.1 pips; The forecast is 55.8 points.
13:45 Universal time - The index of business activity in the US services sector: Prev. 54.9 pips; The forecast is 55.1 points.
13:45 Universal time - The index of business activity in the US manufacturing sector: Prev. 60.7 pips; Forecast 60.3 points.
* The index of business activity in the service sector is an indicator that is determined based on a survey of managers of companies working in the service sector in order to assess the current situation in this sector, as well as possible prospects.
* The index of business activity in the manufacturing sector is an indicator of changes in business conditions in the industrial sector in the reporting month. The index is calculated on the basis of monthly surveys of supply managers working in private companies in the manufacturing sector.
Trading plan for EUR/USD on October 22:
Here, special attention is paid to the pivot point of 1.1620, since keeping the price below will lead to the execution of technical analysis. This will indicate a phased decline towards the local low (1.1524) of October 12.
An alternative scenario of market development considers the subsequent price movement within the borders of 1.1620/1.1669. This will lead to a violation of the theory of graphical analysis, where traders will continue to trade on the principle of breaking one or another border of the set range.
Trading plan for GBP/USD on October 22:
It can be assumed that the resistance area still plays a key role in the market, where a change of trading interests is not excluded. If the expectation is confirmed, a gradual weakening of the pound sterling will be considered, which will lead to the restoration of the volume of short positions relative to the corrective course.
Traders will consider an alternative scenario if the price holds above the resistance area. This will lead to a prolongation of the correction course towards the level of 1.3900.
What is reflected in the trading charts?
A candlestick chart view is graphical rectangles of white and black light, with sticks on top and bottom. When analyzing each candle in detail, you will see its characteristics of a relative period: the opening price, closing price, and maximum and minimum prices.
Horizontal levels are price coordinates, relative to which a stop or a price reversal may occur. These levels are called support and resistance in the market.
Circles and rectangles are highlighted examples where the price of the story unfolded. This color selection indicates horizontal lines that may put pressure on the quote in the future.
The up/down arrows are the reference points of the possible price direction in the future.