Here are the details of the economic calendar from November 2:
There was an empty macroeconomic calendar yesterday, with everyone eagerly awaiting the result of the two-day Federal Open Market Committee (FOMC) meeting.
Analysis of trading charts from November 2:
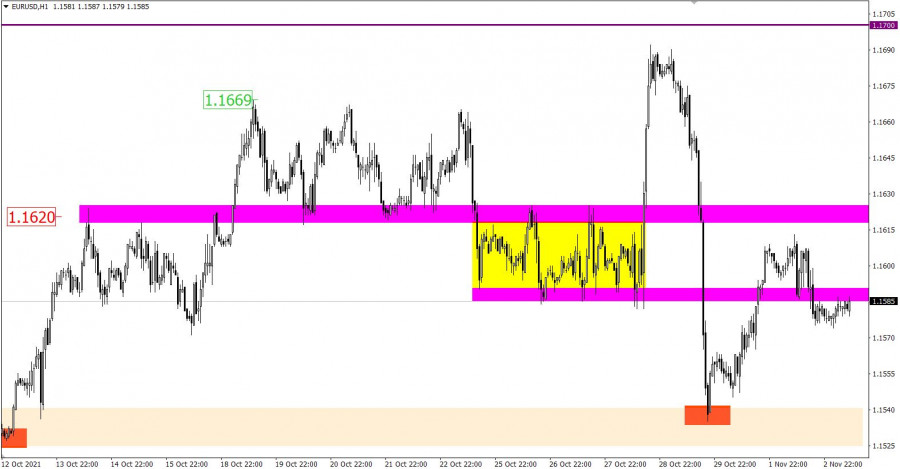
The value of the European currency weakened slightly, but mostly it stood still, which indicates the process of accumulation of trading forces before the important events.
It is worth considering that the downward cycle from the beginning of June is considered the main movement that traders are focused on.
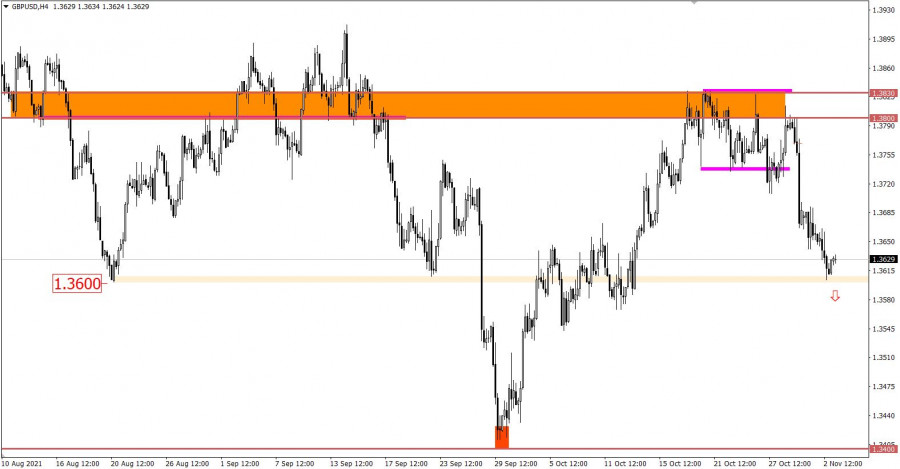
In turn, the pound has lost more than 180 points in value for three trading days. This is a strong price change, which signals the speculative behavior of market participants. During the decline, the support level of 1.3600 was reached, where traders naturally reduced the volume of short positions. As a result, there was a pullback in the price.
In the previous analytical review, a scenario of a price rebound from the support level of 1.3600 was indicated. This scenario of market development could bring us profit.
November 3 economic calendar:
An explanatory note on the course of the two-day FOMC meeting will be published today at 18:00 Universal time, where the key rate will remain unchanged at the level of 0-0.25%. Here, traders are interested in the news regarding the official announcement of the curtailment of the QE program.
If we hear significant news about the curtailment of QE in the shortest possible time, the US dollar will receive an impressive incentive to strengthen its position.
During the period of the results of the meeting and the press conference with Jerome Powell, high activity in the financial markets is expected.
Trading plan for EUR/USD on November 3:
The market may initially stagnate since the results of the FOMC meeting will be known today. This will be followed by speculative surges, depending on the decision of the regulator. The local low of 1.1524 is considered as a support point. The current level of 1.1700 may act as a resistance.
Trading plan for GBP/USD on November 3:
In this situation, it is possible to form a pullback towards the level of 1.3655 with a subsequent transition to the stagnation stage.
The volume of short positions will increase when the price is kept below the level of 1.3590 in a four-hour period. This price step will indicate a signal to sell the pound sterling.
What is reflected in the trading charts?
A candlestick chart view is graphical rectangles of white and black light, with sticks on top and bottom. When analyzing each candle in detail, you will see its characteristics of a relative period: the opening price, closing price, and maximum and minimum prices.
Horizontal levels are price coordinates, relative to which a stop or a price reversal may occur. These levels are called support and resistance in the market.
Circles and rectangles are highlighted examples where the price of the story unfolded. This color selection indicates horizontal lines that may put pressure on the quote in the future.
The up/down arrows are the reference points of the possible price direction in the future.