Bitcoin was trading near the all-time high, preparing for the final breakthrough of the $70k mark. However, it dropped sharply due to negative news. Yesterday, BTC sank by 9% after almost approaching an important support zone of $60.2k. Yet, bulls managed to push the coin out of the negative zone. Nevertheless, BTC is still in the negative zone and has every chance to start the correction.
First of all, it is important to analyze reports that triggered such a strong decline in the entire crypto market. The main reason for the fall was the infrastructure bill signed by US President Biden. According to this document, crypto exchanges will have the same status as brokers. Thus, exchanges will be required to report user transactions and pay taxes. The taxes from the crypto industry are projected to bring more than $28 billion to the government. The crypto market reacted negatively to such strict regulation, sending many digital assets into a correction.
Consolidation is the period when a certain cryptocurrency is located within a narrow horizontal price channel. Usually, it indicates price stabilization or weakness of the trend (bullish or bearish).
The Relative Strength Index (RSI) is a technical indicator that allows traders to determine the strength of a trend (descending or ascending) and find out possible changes in the price movement. Thanks to this indicator, it is possible to determine whether an asset is overbought or oversold. The appropriate level for this chart is 60 if we need a bullish trend. It indicates a high demand for the coin and the strength of the current upward momentum. When crossing this mark, the coin begins to move towards the overbought zone.
MACD (index of convergence/divergence of moving averages) is an indicator that allows traders to identify the trend based on the movement of moving averages and find metric values between them. The bullish signal is the intersection of the white line under the red and bearish. When the white line from above crosses the red, it indicates a downward movement.
Stochastic (stochastic oscillator) indicates the strength of the momentum of the current prevailing trend. If the indicator is above the 80 mark, then the asset can be considered overbought. If the stochastic is below 20, then an asset is oversold.
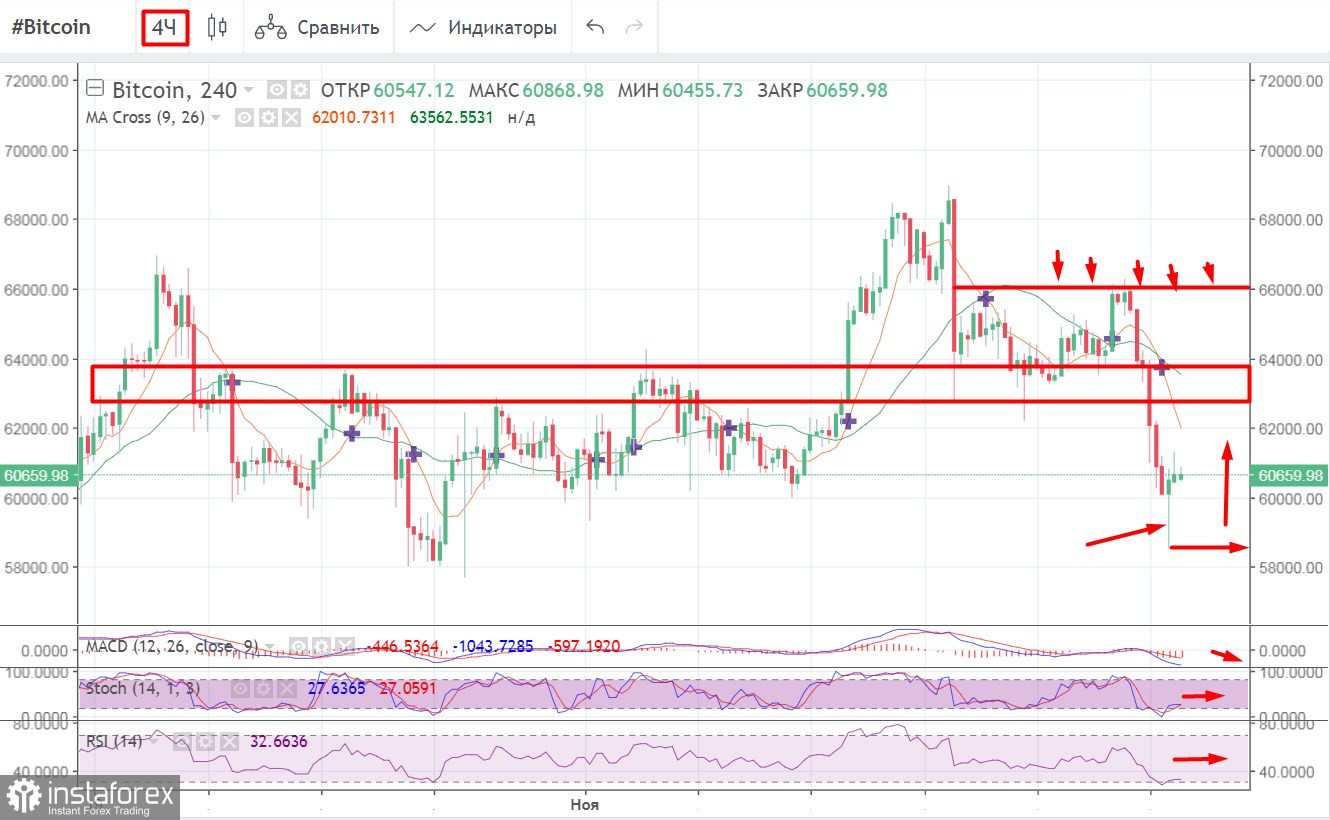
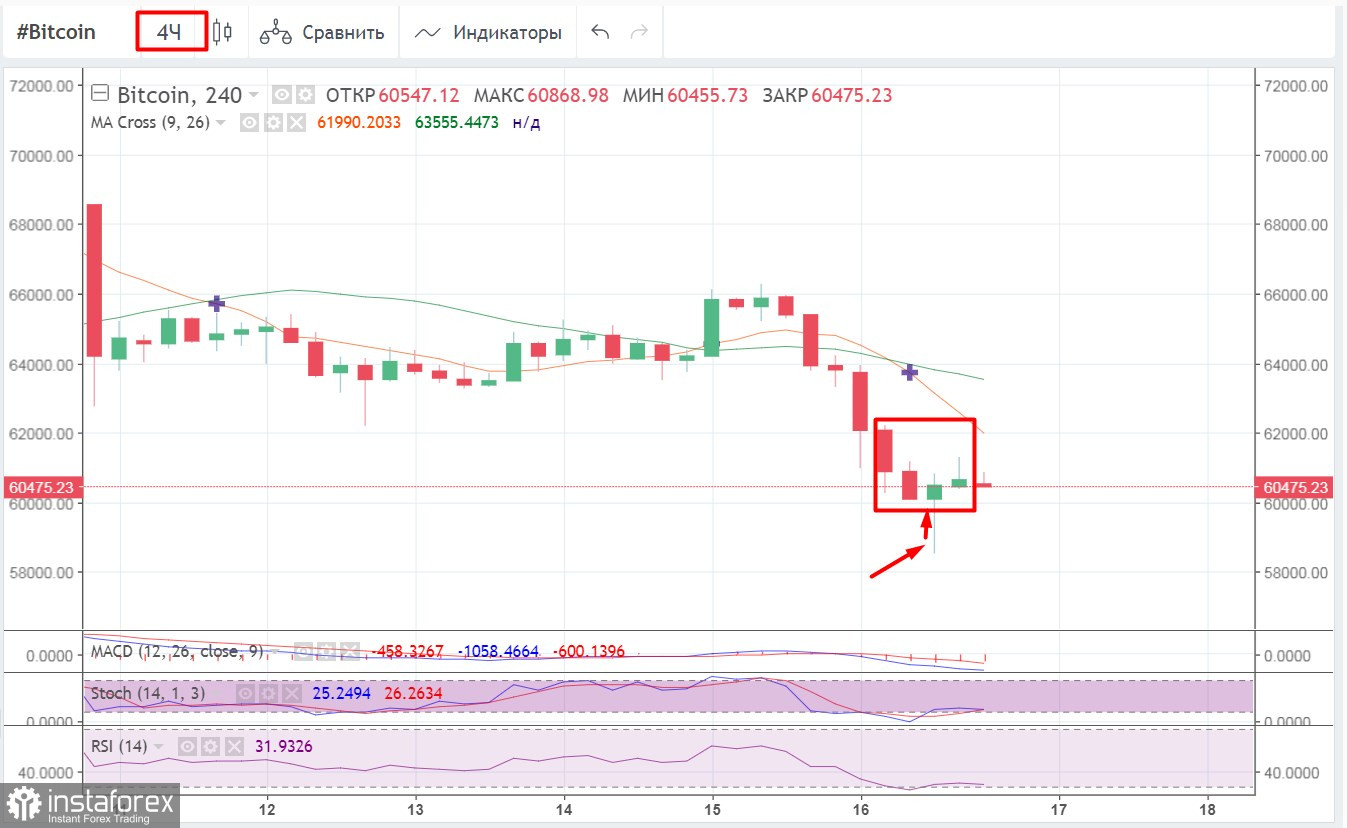
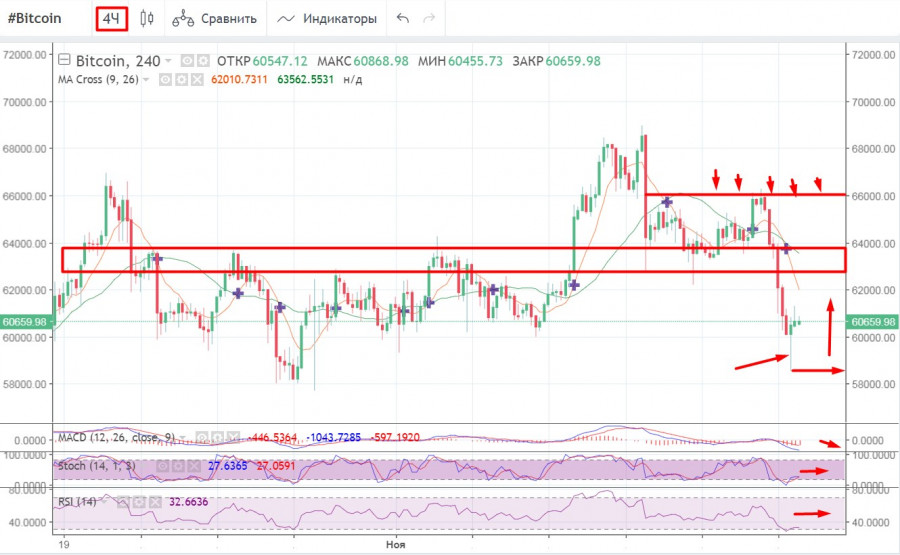
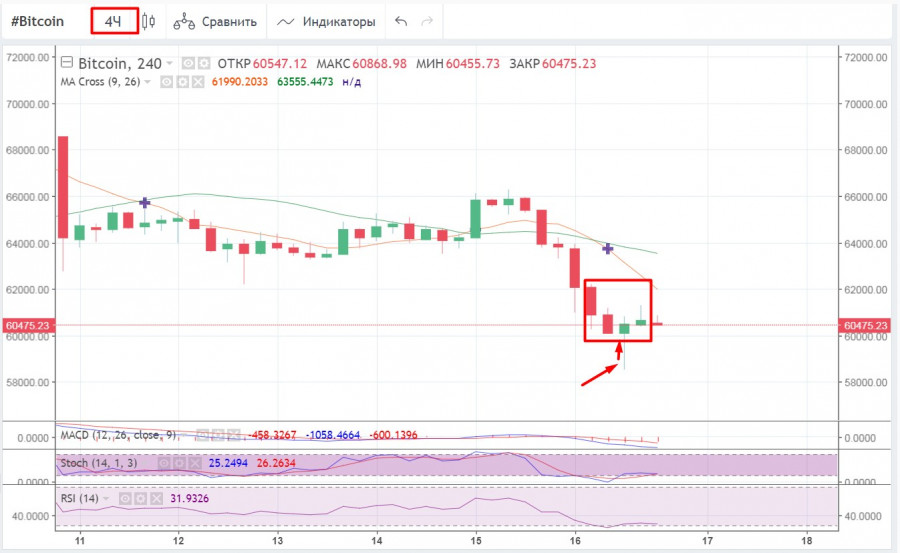
Bitcoin tumbled by 8% in a day following the news on the crypto exchanges. The price reached the $58.7k mark on the 4H chart. In addition, a strong support level located in this area pushed the price above $60k. The long lower wick from the green candlestick confirms this price movement and strong bullish momentum. Bitcoin is weak. It may face the resistance level around the $62k mark. However, the coin is likely to will continue to trade in the narrow range of $ 60.2k-$62k. Technical indicators do not signal the start of a recovery cycle. This is why BTC will continue to decline. The MACD indicator also signals a downward movement. It has crossed the zero mark and it is located in 850. The stochastic and the relative strength index also indicate a decline. The RSI indicator fell below the 40 mark. Importantly, bulls failed to regain ground. During the recovery from $58.6k, the price tried to close above the previous red candlestick. Yet, in the end, it could not even half absorb the volumes of the bearish candlestick. This indicates the weakness of bulls and the downward movement.
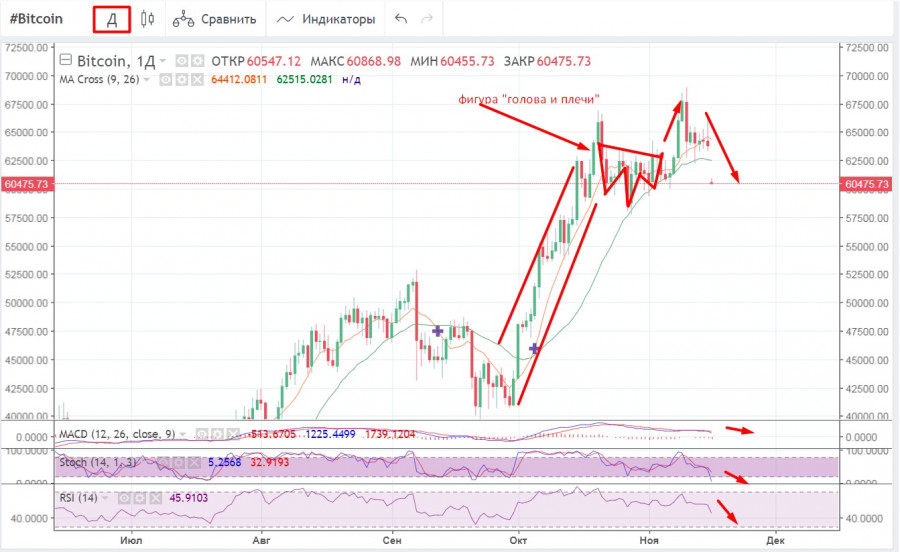
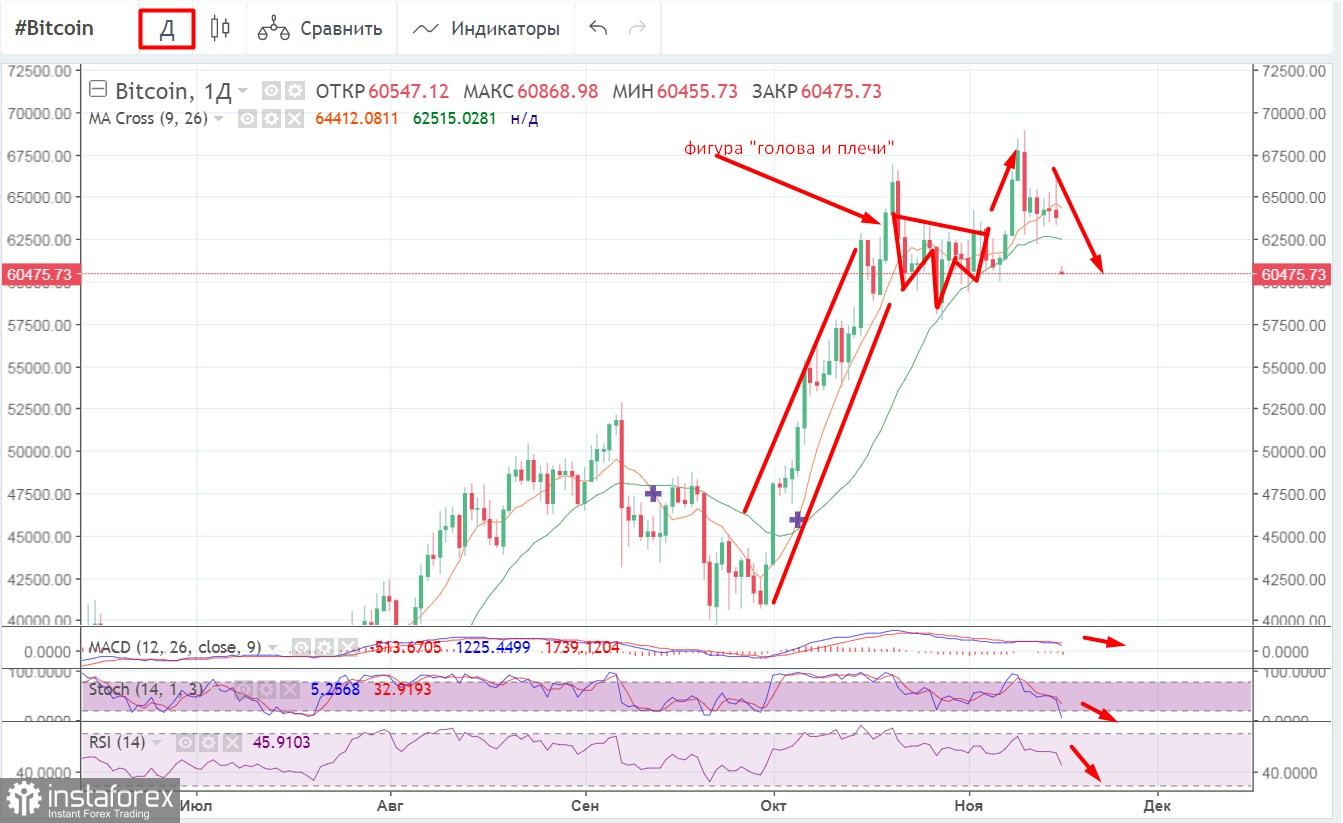
On the daily chart, before the decline, the head and shoulders pattern was formed. The formation of this figure ended with a bullish breakdown of the shoulder line, which was indicated on the chart. At the same time, bulls failed to strengthen due to volatility and negative news. The price formed a bearish candlestick, signaling a further decline. Over the past few days, bears managed to take the upper hand as indicated by formations on horizontal charts and technical indicators of BTC. The MACD formed a bearish intersection, showing a long-term downward momentum. The stochastic and the RSI indicators broke through the bullish zone and went below the 40 mark. For this reason, we can expect a breakout of the $60.2k mark. In case of further decline, the price is likely to meet the resistance level of $58.6k. BTC has already retreated from this level. However, the more often the level is tested, the more likely it will be broken. Therefore, there is a possibility of a further drop to $53.6 k-$57.5 k. At this level, traders are likely to lock in profits before the final rally.