Analysis of previous deals:
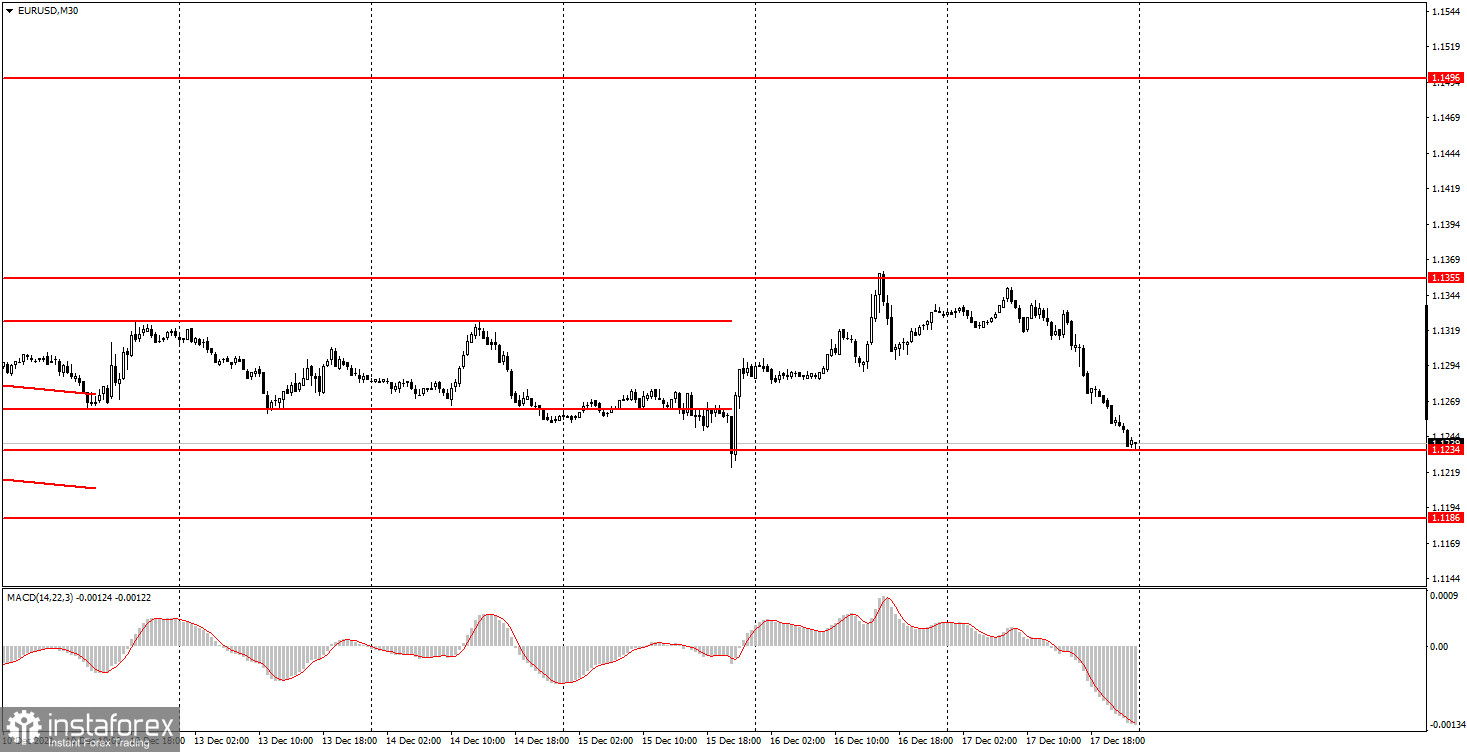
30M chart of the EUR/USD pair
The EUR/USD pair traded quite volatile on Friday, despite the fact that macroeconomic statistics were not expected for that day, as well as important fundamental events. Nevertheless, a powerful downward movement began in the afternoon, which we associate with the events of Wednesday and Thursday. Namely, the meetings of the central banks of the European Union and the United States, which we discussed earlier. In short, the US dollar fell against the euro when it was supposed to rise. Thus, on Friday, perhaps, this way there was just a "debt repayment". Immediately after the European Central Bank and Federal Reserve meetings, traders for some reason bought the pair, and on Friday everything fell into place. As a result, the euro/dollar turned out to be at the week's close near the level of 1.1234, which is the lower boundary of a new, wider horizontal channel, and is also located near the pair's annual lows. In the European Union, only the inflation report was published on Friday, but not in the first estimate, so its value was no different from the forecast. And there was no market reaction either.
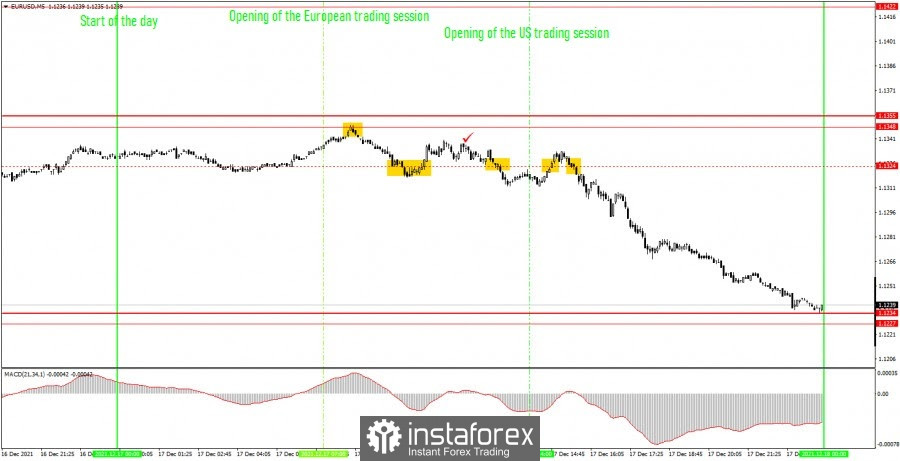
5M chart of the EUR/USD pair

On the 5-minute timeframe, the downward movement looks even more impressive. But, unfortunately, it was not possible to work it out. Now we'll take a closer look at why. Although, in principle, this is understandable without any explanations from the chart above. The fact is that in the first half of the day there was nearly a flat movement due to which the price overcame the level of 1.1324 several times, each time generating a false signal. But first things first. At first, a rather strong sell signal was formed - a rebound from the level of 1.1348. Novice traders could work it out. It should have been left near the level of 1.1324, from which there was also a rebound. The profit was about 10 points. After a rebound from the level of 1.1324, long positions should have been opened, but the price could not go up even 15 points, so it was not possible to set Stop Loss to breakeven, and the deal was closed after the price settled below the level of 1.1324 at a loss of 12 points. Positions should also be opened on a new sell signal, but it turned out to be false, since literally half an hour later the pair changed its direction of movement again and settled above 1.1324. Loss of 15 points. But all subsequent signals near the level of 1.1324 should not have been worked out anymore, since after two false trades near the same level, we do not reject it further. But ironically, it was at this time that a strong sell signal was formed, after which the pair went down 75 points. We also advise you to consider trading signals for the GBP/USD pair, where trading was more successful.
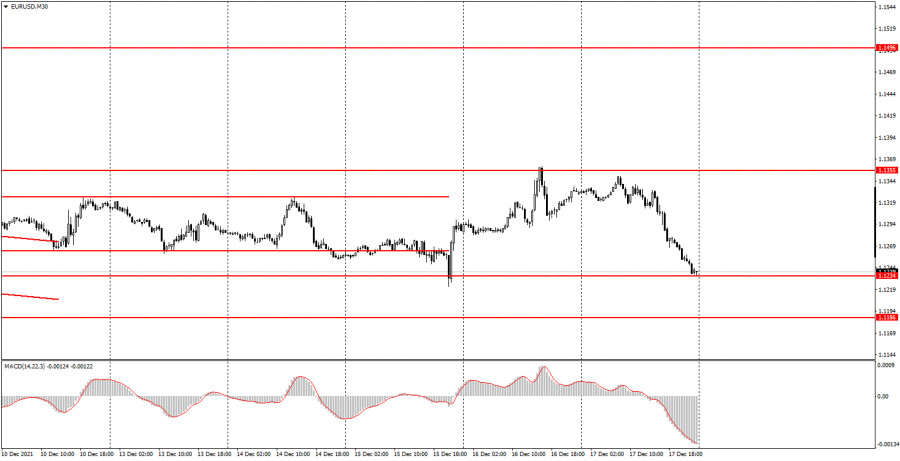
How to trade on Monday:
On the 30-minute timeframe, the euro/dollar pair is now already in the 1.1234-1.1355 horizontal channel and is near its lower limit at this time. Thus, a rebound from it is possible, followed by a movement to the upper border. There is no trend line now, as there is no trend itself. On the 5-minute timeframe, the key levels for December 20 are 1,1186, 1,1227 - 1,1234, 1,1348-1,1355, 1,1422. Take Profit, as before, we set at a distance of 30-40 points. Stop Loss - breakeven when the price passes in the right direction by 15 points. At the 5M TF, the target can be the nearest level, if it is not located too close or too far away. If it is located– then you should act on the situation or work on Take Profit. No important reports or other events will be published in the European Union and America on Monday. Thus, volatility may be weak, especially as the Christmas week begins.
Basic rules of the trading system:
1) The signal strength is calculated by the time it took to form the signal (bounce or overcome the level). The less time it took, the stronger the signal.
2) If two or more deals were opened near a certain level based on false signals (which did not trigger Take Profit or the nearest target level), then all subsequent signals from this level should be ignored.
3) In a flat, any pair can form a lot of false signals or not form them at all. But in any case, at the first signs of a flat, it is better to stop trading.
4) Trade deals are opened in the time period between the beginning of the European session and until the middle of the American one, when all deals must be closed manually.
5) On the 30-minute TF, using signals from the MACD indicator, you can trade only if there is good volatility and a trend, which is confirmed by a trend line or a trend channel.
6) If two levels are located too close to each other (from 5 to 15 points), then they should be considered as an area of support or resistance.
On the chart:
Support and Resistance Levels are the Levels that serve as targets when buying or selling the pair. You can place Take Profit near these levels.
Red lines are the channels or trend lines that display the current trend and show in which direction it is better to trade now.
The MACD indicator (14,22,3) consists of a histogram and a signal line. When they cross, this is a signal to enter the market. It is recommended to use this indicator in combination with trend lines (channels and trend lines).
Important speeches and reports (always contained in the news calendar) can greatly influence the movement of a currency pair. Therefore, during their exit, it is recommended to trade as carefully as possible or exit the market in order to avoid a sharp price reversal against the previous movement.