empty
 
 
11.01.2022 01:05 PM
Technical analysis of USD/JPY for January 11, 2022

Hello, dear traders!

Today, I am going to analyze the dollar/yen pair for you. Although a new trading week has begun, I'd like to analyze the pair's movement since last Friday.

Weekly chart

This image is no longer relevant

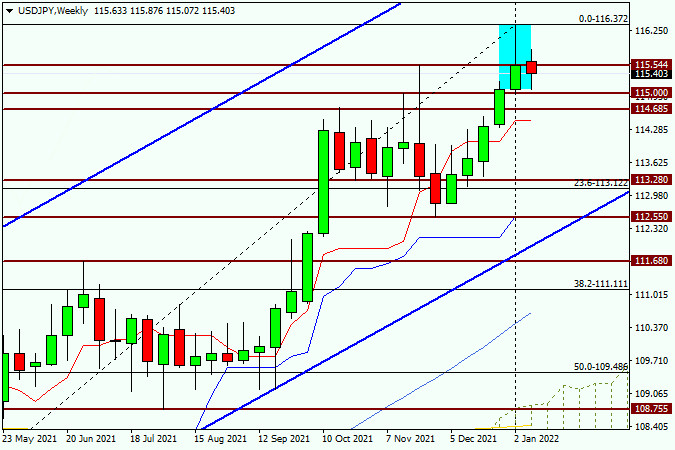
The USD/JPY pair kept scoring gains as I had expected. However, despite the continuing uptrend, bulls encountered strong resistance at 115.54 and failed to break through the barrier. This fact is confirmed by a very long upper shadow of the latest highlighted candlestick. In addition, the price settled precisely at the level of 115.54 at the close of the previous trading week (January 3-7). If we take into account that the quote grew to 116.37 last week but failed to consolidate there and closed at 115.55, we can draw a conclusion that it was an unsuccessful week for USD/JPY bulls.

Since the beginning of the current trading week, the price has been retracing down to the important historic, technical, and psychological level of 115.00. The quote has encountered support in this area and has somewhat recovered. At the moment of writing, the dollar/yen pair is trading around 115.34. At the same time, the quote's further movement remains vague. Yesterday's uptrend could extend if the price closes above the high of 116.37, and it is not an easy task at the moment. To stop the uptrend, bears should close below 115.00 at the end of this week. Meanwhile, consolidation below the red Tenkan Sen (114.46) will serve as the confirmation of the end of the uptrend.

Daily chart

This image is no longer relevant

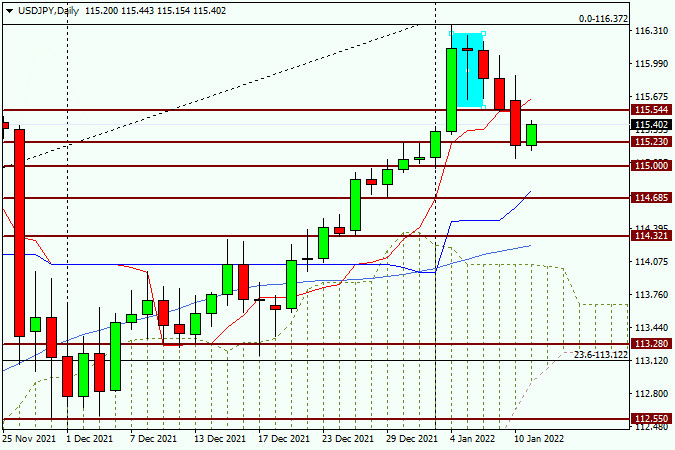
According to the D1 chart, the quote reversed and went down after the formation of the highlighted candlestick on January 5. This candlestick is nothing more than the hanging man reversal pattern. Unfortunately, it appeared below the previous large bullish candlestick (green). Anyway, the market turned bearish. The quote fell below the red Tenkan Sen. In case the price rises to this line, it may encounter strong resistance there and reverse again.

So, if you are looking for options to sell the dollar/yen pair, it is the Tenkan Sen (115.6) on the D1 chart. Meanwhile, traders could consider opening long positions at the most favorable prices after a short-term drop to 114.80. The blue Kijun Sen is located there, which is able to provide solid support for the pair and resume its growth. These are my trading recommendations based on the current technical analysis of the two charts. At this point, it is hard to determine exactly whether it is a reversal or a correction. Perhaps I will once again analyze the dollar/yen pair this week to see where the price will be heading.

Best of luck!

รับผลกำไรจากการเปลี่ยนแปลงอัตราสกุลเงินดิจิทัลกับ InstaForex.
ดาวน์โหลด MetaTrader 4 และเปิดการซื้อขายครั้งแรกของคุณ.
  • Grand Choice
    Contest by
    InstaForex
    InstaForex always strives to help you
    fulfill your biggest dreams.
    เข้าร่วมการแข่งขัน
  • Chancy Deposit
    ฝากเงินในบัญชีของคุณใน $3,000 และรับ $9000 ไปเพิ่ม!
    ใน พฤษภาคม ทางเราได้ออก$9000 ภายในแคมเปญ Chancy Deposit !
    คว้าโอกาสที่จะชนะด้วยการฝากเงิน $3,000 ไปในบัญชีเทรด เมื่อทำตามเงื่อนไขนี้แล้ว คุณก็จะกลายเป็นผู้เข้าร่วมแคมเปญ
    เข้าร่วมการแข่งขัน
  • เทรดให้ดีแล้วคว้ารางวัล
    เติมเงินในบัญชีของคุณอย่างน้อย $500 สมัครเข้าร่วมการแข่งขัน และลุ้นรับรางวัลอุปกรณ์ติดต่อสื่อสารแบบพกพา
    เข้าร่วมการแข่งขัน
  • โบนัส 100%
    โอกาสพิเศษของคุณในการรับโบนัส 100% จากเงินฝากของคุณ
    รับโบนัส
  • โบนัส 55%
    สมัครรับโบนัส 55% สำหรับการฝากทุกครั้ง
    รับโบนัส
  • โบนัส 30%
    รับโบนัส 30% ทุกครั้งที่คุณเติมเงินในบัญชีของคุณ
    รับโบนัส


บทความแนะนำ

หากไม่สะดวกคุยในตอนนี้
ระบุคำถามไว้ได้ใน แชท.
Widget callback