For long positions on EUR/USD
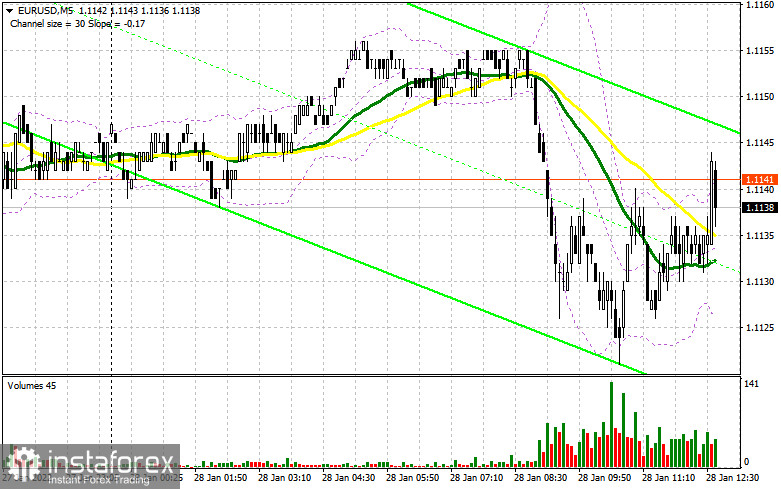
In my morning review, I outlined the level of 1.1118 as an entry point for opening positions. Now let us have a look at the 5-minute chart and describe the current situation. Low activity of buyers in the first half of the day even amid mixed data in the Eurozone resulted in the retest of the local low. Unfortunately, the price failed to reach the level of 1.1118. Therefore, there was no entry point for going long. In the second half of the day, the technical picture changed slightly.
The American session will reveal important economic data in the US which may push the EUR/USD pair below 1.1118. Now, this level has turned into support at 1.1122.
Although bulls managed to protect the lows in the early session, taking advantage of the MACD divergence and low activity of sellers, it is still too early to say that the bottom has been reached. The main goal for bulls is to defend the level of 1.1122, which is their last hope for an upward correction. A false breakout of 1.1122 will serve as a buy signal for the euro. A more extended upward correction will occur only if the reports on US consumer spending and income turn out to be weaker than expected.
As was mentioned above, a return to the level of 1.1167 is another primary task for buyers. Moving averages are located above this level and support the bearish trend. Consolidation above this range will generate a buy signal on EUR/USD. If so, the price may recover to the 1.1200 area. A more distant target will be the high of 1.1236. However, it will be difficult for the pair to reach it without downbeat data from the US. This is where I recommend taking profit.
If the pair goes down during the American session and the bulls' activity is low at 1.1122, the pressure on the euro can seriously increase. In this case, it is better not to wait for lows or catch a rebound. I would advise you to wait until the price reaches a new low at 1.1081. However, you can open long positions there following a false breakout. It is possible to buy EUR/USD from 1.1034 and 1.0994 immediately on a rebound, keeping in mind an upward correction of 20-25 pips during the day.
For short positions on EUR/USD
Sellers continue to control the market, and the unsuccessful attempt to break through 1.1118 does not cancel the downtrend. Markets hope to see positive data on consumer spending and income in the US as well as on Michigan inflation expectations. A sharp increase in the indicator can lead to an instant strengthening of the US dollar, and the report on the consumer sentiment index from the University of Michigan will encourage traders to buy safe haven assets. Decreased trading activity below 1.1122 is a bad sign for bulls as it may lead to a prolonged downtrend.
As long as the pair is trading below 1.1167, we can expect a fall to a low of 1.1122. A breakout and testing of this area from the bottom up, together with strong data on the US economy, will give an additional signal to open short positions with the targets at 1.1081 and 1.1034. A further target will be the area of 1.0994 where I recommend taking profit.
If the euro rises during the New York session, bears will need to defend the resistance of 1.1167. A false breakout of this level will form an additional entry point for short positions. You can sell EUR/USD immediately on a rebound from 1.1200, or even higher - from 1.1236, keeping in mind a downward correction of 15-20 pips.
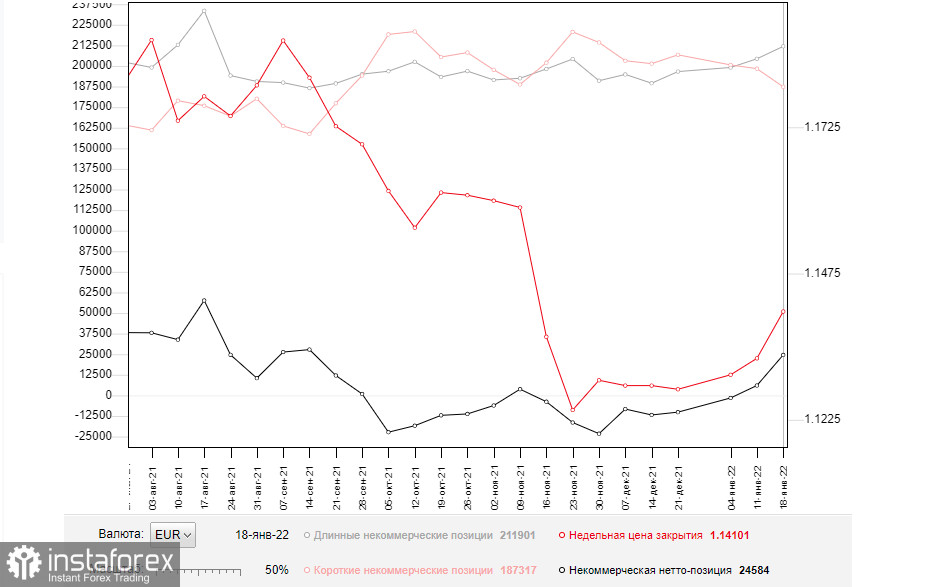
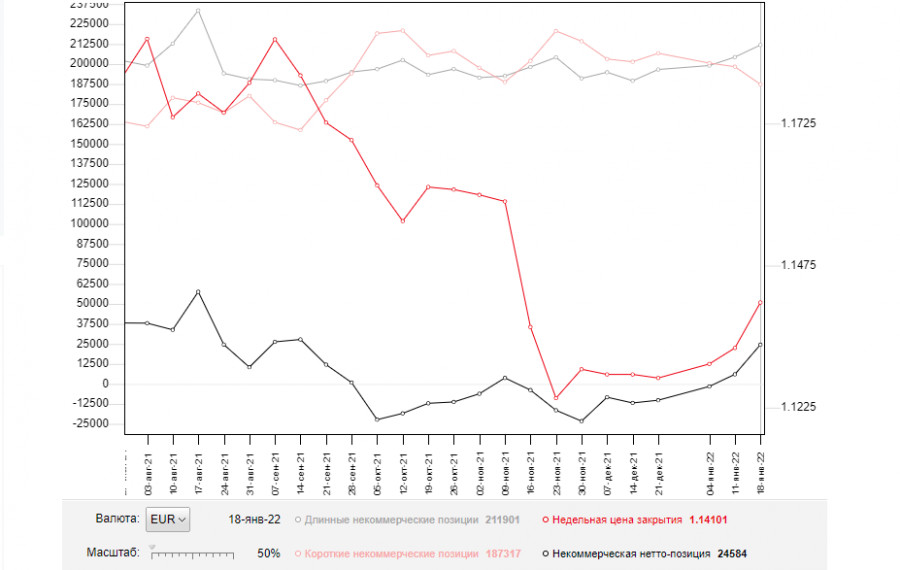
The COT (Commitment of Traders) report for January 18 revealed growth in the number of long positions and a decline in the short ones. As a result, the value of the positive delta became higher. This means that even despite anticipated changes in the Fed's policy, the euro remains in demand. Strong correction in EUR/USD means higher demand for the pair. This week, all eyes are on the meeting of the Federal Open Market Committee, which will announce its decision on monetary tightening. Some traders expect the Fed to raise interest rates as soon as January and not in March as was previously stated. In addition, the regulator will start to reduce its balance sheet. A lot will depend on Jerome Powell's rhetoric. If he expresses worries about inflation, the US dollar is likely to strengthen. At the moment, markets are discussing the possibility of four and even five rate hikes this year. In the meantime, the European Central Bank is planning to end its emergency bond buying program in March this year. However, the European regulator is not going to tighten its policy any further. This is the reason that limits the upside potential of risk assets. The COT report indicated that the number of long positions of the non-commercial group of traders increased from 204,361 to 211,901, while short positions of the same group dropped from 198,356 to 187,317. This proves that traders continue to add more long positions on the euro in hope of developing an uptrend. Last week, the total non-commercial net position remained in the positive zone at 24,584 versus 6,005. The closing price of the week increased to 1.1410 against 1.1330 a week earlier.
Indicator signals:
Moving Averages
Trading below the 30- and 50-day moving averages indicates a bear market.
Please note the time period and prices of moving averages are analyzed only for the H1 chart which differs from the general definition of the classic daily moving averages on the D1 chart.
Bollinger Bands
In case of growth, the middle band of the indicator around 1.1160 will act as resistance.
Description of indicators:
• A moving average determines the current trend by smoothing volatility and noise. 50-day period; marked in yellow on the chart;
• A moving average determines the current trend by smoothing volatility and noise. 30-day period; marked in green on the chart;
• Indicator MACD (Moving Average Convergence/Divergence) Fast EMA, 12-day period; Slow EMA, 26-day period. SMA with a 9-day period;
• Bollinger Bands: 20-day period;
• Non-commercial traders are speculators such as individual traders, hedge funds, and large institutions who use the futures market for speculative purposes and meet certain requirements;
• Long non-commercial positions represent the total number of long open position of non-commercial traders;
• Short non-commercial positions represent the total number of short open position of non-commercial traders;
• The total non-commercial net position is the difference between short and long positions of non-commercial traders.