empty
 
 
24.11.2022 10:29 AM
Technical Analysis of GBP/USD for November 24, 2022

Technical Market Outlook:

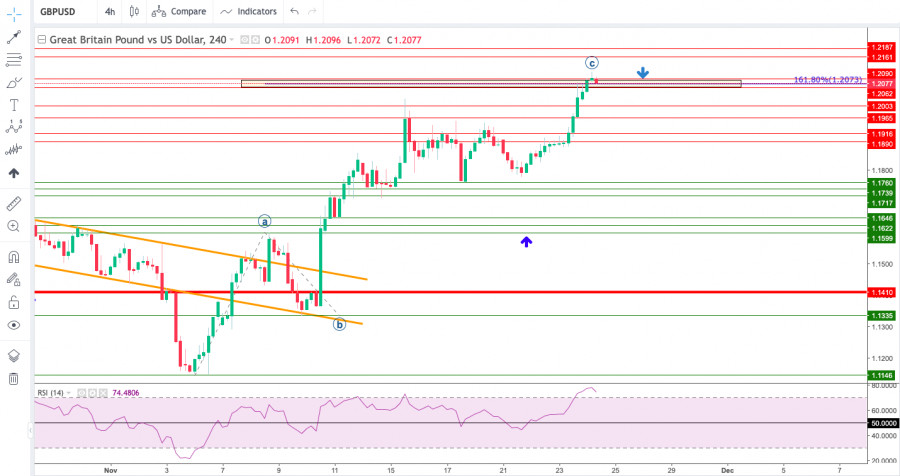
The GBP/USD pair has hit the target for bulls located at 161% Fibonacci extension level at 1.2073. This might be a perfect target for wave C as well, so please pay attention to the bears response. The market has done a Pin Bar candlestick at the top of the rally at the H4 time frame chart already. The intraday technical support is seen at 1.2003, 1.1965 and 1.1916 and only a clear and sustained breakout below this zone might confirm the sooner than expected termination of the wave C. The strong and positive momentum supports the short term bullish outlook for GBP on the H4 time frame chart, however the market conditions are extremely overbought.

This image is no longer relevant

Weekly Pivot Points:

WR3 - 1.19775

WR2 - 1.19122

WR1 - 1.18732

Weekly Pivot - 1.18469

WS1 - 1.18079

WS2 - 1.17816

WS3 - 1.17163

Trading Outlook:

The bulls are temporary in control of the market and the 38% Fibonacci retracement of the last wave down located at 1.1830 had been tested already as the bulls keep trying to gain move upside ground. On the other hand, the level of 1.0351 has not been tested since 1985, so the down trend is strong. In order to terminate the down trend, bulls need to break above the level of 1.2275 (swing high from August 10th).

GBPUSD
Great Britain Pound vs US Dollar
Select timeframe
5
min
15
min
30
min
1
hour
4
hours
1
day
1
week
Start trade
Start trade
  • Grand Choice
    Contest by
    InstaForex
    InstaForex always strives to help you
    fulfill your biggest dreams.
    เข้าร่วมการแข่งขัน
  • Chancy Deposit
    ฝากเงินในบัญชีของคุณใน $3,000 และรับ $8000 ไปเพิ่ม!
    ใน มีนาคม ทางเราได้ออก$8000 ภายในแคมเปญ Chancy Deposit !
    คว้าโอกาสที่จะชนะด้วยการฝากเงิน $3,000 ไปในบัญชีเทรด เมื่อทำตามเงื่อนไขนี้แล้ว คุณก็จะกลายเป็นผู้เข้าร่วมแคมเปญ
    เข้าร่วมการแข่งขัน
  • เทรดให้ดีแล้วคว้ารางวัล
    เติมเงินในบัญชีของคุณอย่างน้อย $500 สมัครเข้าร่วมการแข่งขัน และลุ้นรับรางวัลอุปกรณ์ติดต่อสื่อสารแบบพกพา
    เข้าร่วมการแข่งขัน
  • โบนัส 100%
    โอกาสพิเศษของคุณในการรับโบนัส 100% จากเงินฝากของคุณ
    รับโบนัส
  • โบนัส 55%
    สมัครรับโบนัส 55% สำหรับการฝากทุกครั้ง
    รับโบนัส
  • โบนัส 30%
    รับโบนัส 30% ทุกครั้งที่คุณเติมเงินในบัญชีของคุณ
    รับโบนัส

Recommended Stories

Technical analysis of GBP/USD for March 20, 2023

The GBP/USD pair traded higher and closed the day in the positive territory near the price of 1.2208. Right now, it was trading in a narrow range of 1.2150 staying

Mourad El Keddani 13:04 2023-03-20 UTC+2

Forex forecast 03/20/2023 EUR/USD, USD/JPY, GBP/USD, Gold and Bitcoin from Sebastian Seliga

Let's take a look at the technical picture of EUR/USD, USD/JPY, GBP/USD, Gold and Bitcoin

Sebastian Seliga 12:48 2023-03-20 UTC+2

Technical analysis of EUR/USD for March 20, 2023

The EUR/USD pair rallied upwards strongly yesterday to breach the bearish channel's resistance and settles above it, opening the way to turn to the upside on the intraday and short-term

Mourad El Keddani 12:21 2023-03-20 UTC+2

Video market update for March 20, 2023

Potential for rally on USD/CHF

Petar Jacimovic 12:06 2023-03-20 UTC+2

NZDUSD, H4 | Potential Bearish Reversal

The NZD/USD chart currently displays a bearish momentum, with price below a major descending trend line and the bearish Ichimoku cloud. The potential price movement could involve a bearish reaction

Dean Leo 09:46 2023-03-20 UTC+2

XAUUSD, Day | Potential Bearish Reversal from?

Gold prices have been experiencing a bearish trend for some time now, which is reinforced by a major descending trend line on the XAU/USD chart. The current price could potentially

Dean Leo 09:45 2023-03-20 UTC+2

Analysis of Gold for March 20,.2023 - Extreme bullish condiiton, potential for the further upside movement

Technical analysis: Gold has been trading upside this morning and I found that Gold is the very strong upside momentum and there is the chance for the multi year highs

Petar Jacimovic 09:25 2023-03-20 UTC+2

USD/CHF analysis for March 20, 2023 - Breakout of the triangle pattern to the upside

Technical analysis: USD/CHF has been trading upside this morning and I found the breakout of the triangle pattern in the background. Due to the breakout of the tight triangle

Petar Jacimovic 09:18 2023-03-20 UTC+2

Indicator analysis: Daily review of GBP/USD on March 20, 2023

The pound-dollar pair may move upward from the level of 1.2176 (closing of Friday's daily candle) to 1.2273, the 76.4% pullback level (blue dotted line). Upon reaching this level

Stefan Doll 09:17 2023-03-20 UTC+2

Indicator analysis: Daily review of EUR/USD on March 20, 2023

The euro-dollar pair may move upward from the level of 1.0666 (closing of Friday's daily candle) to 1.0713, the 38.2% pullback level (red dotted line). When testing this level

Stefan Doll 09:05 2023-03-20 UTC+2
หากไม่สะดวกคุยในตอนนี้
ระบุคำถามไว้ได้ใน แชท.