empty
 
 
30.11.2022 07:00 PM
November 30, 2022 : EUR/USD Intraday technical analysis and trading plan.

This image is no longer relevant

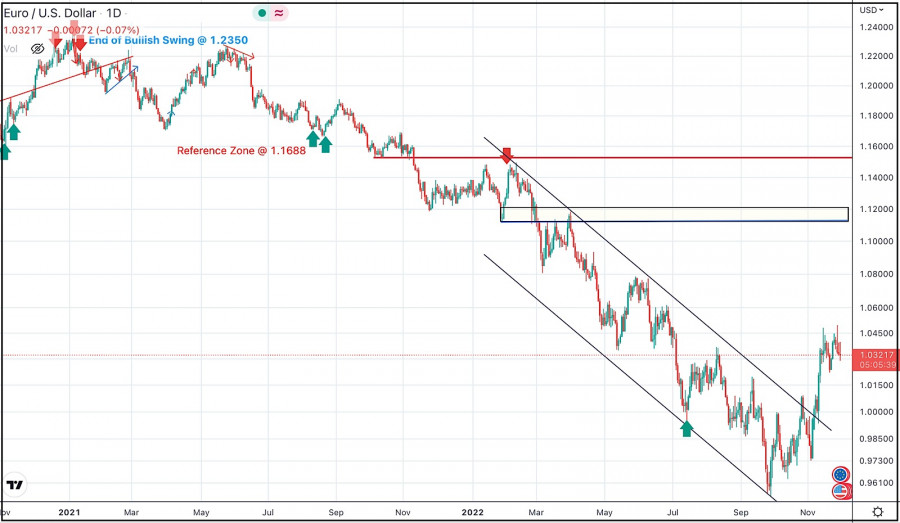
In the intermediate-term, the pair is just above the newly visited price levels around 0.9600 that haven't been visited since 2002.

That's why, some bullish recovery was recently demonstrated especially around such an important psychological support.

The nearest supply level was located around 1.0200 where bearish rejection and a short-term SELL Entry were anticipated.

Hence, another bearish pullback to test the price levels of 0.9500 was recently executed.

Intensive bullish price action was demonstrated around the lower limit of the current movement channel. Initial bullish target around 1.0150 was already reached.

Price action around this key-level should be watched cautiously for further continuation or bearish reversal.

On the other hand, any quick bearish pullback towards the price levels of 1.0000 should be considered as a valid BUY opportunity.

EURUSD
Euro vs US Dollar
Select timeframe
5
min
15
min
30
min
1
hour
4
hours
1
day
1
week
Start trade
Start trade
  • Grand Choice
    Contest by
    InstaForex
    InstaForex always strives to help you
    fulfill your biggest dreams.
    เข้าร่วมการแข่งขัน
  • Chancy Deposit
    ฝากเงินในบัญชีของคุณใน $3,000 และรับ $8000 ไปเพิ่ม!
    ใน มีนาคม ทางเราได้ออก$8000 ภายในแคมเปญ Chancy Deposit !
    คว้าโอกาสที่จะชนะด้วยการฝากเงิน $3,000 ไปในบัญชีเทรด เมื่อทำตามเงื่อนไขนี้แล้ว คุณก็จะกลายเป็นผู้เข้าร่วมแคมเปญ
    เข้าร่วมการแข่งขัน
  • เทรดให้ดีแล้วคว้ารางวัล
    เติมเงินในบัญชีของคุณอย่างน้อย $500 สมัครเข้าร่วมการแข่งขัน และลุ้นรับรางวัลอุปกรณ์ติดต่อสื่อสารแบบพกพา
    เข้าร่วมการแข่งขัน
  • โบนัส 100%
    โอกาสพิเศษของคุณในการรับโบนัส 100% จากเงินฝากของคุณ
    รับโบนัส
  • โบนัส 55%
    สมัครรับโบนัส 55% สำหรับการฝากทุกครั้ง
    รับโบนัส
  • โบนัส 30%
    รับโบนัส 30% ทุกครั้งที่คุณเติมเงินในบัญชีของคุณ
    รับโบนัส

Recommended Stories

Video market update for March 28, 2023

Potential for the upside move on crude

Petar Jacimovic 12:54 2023-03-28 UTC+2

Forex forecast 03/28/2023 AUD/USD, EUR/USD, USD/CAD and Gold from Sebastian Seliga

Let's take a look at the technical picture of AUD/USD, EUR/USD, USD/CAD and Gold

Sebastian Seliga 10:51 2023-03-28 UTC+2

Indicator analysis: Daily review of GBP/USD on March 28, 2023

The pound-dollar pair may move upward from the level of 1.2282 (closing of yesterday's daily candle) to test 1.2352, the 85.4% pullback level (blue dotted line). When testing this level

Stefan Doll 09:57 2023-03-28 UTC+2

Indicator analysis: Daily review of EUR/USD on March 28, 2023

The euro-dollar pair may move upward from the level of 1.0796 (closing of yesterday's daily candle) to 1.0835, the 61.8% pullback level (red dotted line). Upon reaching this level, continued

Stefan Doll 09:46 2023-03-28 UTC+2

Technical Analysis of GBP/USD for March 28, 2023

Technical Market Outlook: The GBP/USD pair has broken below the short-term trend line support and made a new local low at the level of 1.2189 and is currently moving

Sebastian Seliga 08:30 2023-03-28 UTC+2

Technical Analysis of EUR/USD for March 28, 2023

Technical Market Outlook: The EUR/USD pair has broken below the short-term trend line support (orange line on chart) and made a local low at the level of 1.0712. Since then

Sebastian Seliga 08:29 2023-03-28 UTC+2

Analysis of Gold for March 28,.2023 - Bear flag pattern and potential for the downside continuation

Technical analysis: Gold has been trading downside yesterday and I see potential for the downside continuation today. Due to the downside momentum in the background and the bear flag pattern

Petar Jacimovic 08:16 2023-03-28 UTC+2

Technical Analysis of Daily Price Movement of Silver Commodity Asset, Tuesday March 28, 2023.

After testing the 22,964 level which is a significant resistance level on the daily chart of Silver commodity assets, it seems that in the next few days Silver

Arief Makmur 08:13 2023-03-28 UTC+2

Technical Analysis of Daily Price Movement Nasdaq 100 Index, Tuesday March 28, 2023.

On the daily chart, the Nasdaq 100 index shows the emergence of the Rising Wedge pattern where this pattern gives an indication that in the next few days #NDX

Arief Makmur 08:13 2023-03-28 UTC+2

USDCHF, H4 | Potential Reversal 1st support ?

The USD/CHF chart currently shows bearish momentum towards the first support level at 0.9120, a strong swing low support level. A second support level is also present at 0.9059

Dean Leo 08:12 2023-03-28 UTC+2
หากไม่สะดวกคุยในตอนนี้
ระบุคำถามไว้ได้ใน แชท.