empty
 
 
07.12.2022 06:27 AM
Trading Signal for Gold (XAU/USD) on December 07-08, 2022: sell in case of pullback at $1,784 or below $1,765 (+1/8 Murray - 21 SMA)

This image is no longer relevant

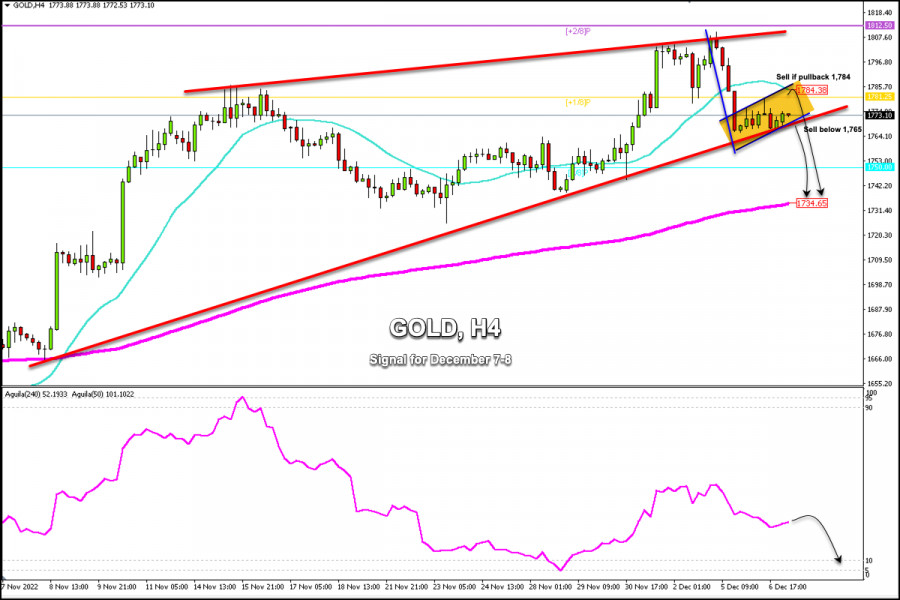
Early in the European session, Gold (XAU/USD) is trading around 1,773 above the uptrend channel and below the 21 SMA located at 1,784. We see a consolidation in the last few hours as investors are waiting for news for precedent from the US, which makes them more cautious.

Having reached the area of 1,810, gold started a strong technical reversal and is now consolidating around 1,766-1,780. A sharp break of 1,765 could accelerate the decline towards 1,730.

On the 4-hour chart, we can see the formation of the inverted pennant pattern, whose break below 1,765 will generate a bearish movement and the price could reach 1,734 and could even fall towards the psychological level of 1,700.

In case gold trades within this pattern (inverted pennant), we could expect a pullback towards 1,784 which represents a strong resistance zone. On the other hand, in case there is a sharp break below this technical pattern, a fall in gold could be confirmed and this would be exposed to the support of 8/8 Murray at 1,750, and the price could even reach the 200 EMA located at 1,734.

Above 1,785, gold could resume its bullish cycle and could even reach +2/8 Murray located at 1,812.

The markets' attention is still focused on the FOMC meeting scheduled for December 13 and 14. Before the policy update, gold is expected to continue with its technical correction because investors could take profits and then resume their bullish cycle.

Our trading plan for the next few hours is to sell gold below 1,765 or wait for a pullback to 1,784 to sell, with targets at 1,750 and 1,765. The eagle indicator is giving a negative signal, which supports our bearish strategy.

EURUSD
Euro vs US Dollar
Select timeframe
5
min
15
min
30
min
1
hour
4
hours
1
day
1
week
Start trade
Start trade
  • Grand Choice
    Contest by
    InstaForex
    InstaForex always strives to help you
    fulfill your biggest dreams.
    เข้าร่วมการแข่งขัน
  • Chancy Deposit
    ฝากเงินในบัญชีของคุณใน $3,000 และรับ $8000 ไปเพิ่ม!
    ใน มีนาคม ทางเราได้ออก$8000 ภายในแคมเปญ Chancy Deposit !
    คว้าโอกาสที่จะชนะด้วยการฝากเงิน $3,000 ไปในบัญชีเทรด เมื่อทำตามเงื่อนไขนี้แล้ว คุณก็จะกลายเป็นผู้เข้าร่วมแคมเปญ
    เข้าร่วมการแข่งขัน
  • เทรดให้ดีแล้วคว้ารางวัล
    เติมเงินในบัญชีของคุณอย่างน้อย $500 สมัครเข้าร่วมการแข่งขัน และลุ้นรับรางวัลอุปกรณ์ติดต่อสื่อสารแบบพกพา
    เข้าร่วมการแข่งขัน
  • โบนัส 100%
    โอกาสพิเศษของคุณในการรับโบนัส 100% จากเงินฝากของคุณ
    รับโบนัส
  • โบนัส 55%
    สมัครรับโบนัส 55% สำหรับการฝากทุกครั้ง
    รับโบนัส
  • โบนัส 30%
    รับโบนัส 30% ทุกครั้งที่คุณเติมเงินในบัญชีของคุณ
    รับโบนัส

Recommended Stories

Forecast for EUR/USD on March 28. ECB's de Cos: regulator will monitor incoming information more closely

On Monday, the EUR/USD pair rebounded from the 1.0750 level and carried on its upward trend toward the corrective level of 200% (1.0861). The US dollar will benefit from

Samir Klishi 17:29 2023-03-28 UTC+2

Forecast for GBP/USD on March 28, 2023

The GBP/USD pair increased on Monday, and today it came quite near to the level of 1.2342, according to the hourly chart. The US dollar will once more benefit from

Samir Klishi 17:17 2023-03-28 UTC+2

Video market update for March 28, 2023

Potential for the upside move on crude

Petar Jacimovic 12:54 2023-03-28 UTC+2

Forex forecast 03/28/2023 AUD/USD, EUR/USD, USD/CAD and Gold from Sebastian Seliga

Let's take a look at the technical picture of AUD/USD, EUR/USD, USD/CAD and Gold

Sebastian Seliga 10:51 2023-03-28 UTC+2

Indicator analysis: Daily review of GBP/USD on March 28, 2023

The pound-dollar pair may move upward from the level of 1.2282 (closing of yesterday's daily candle) to test 1.2352, the 85.4% pullback level (blue dotted line). When testing this level

Stefan Doll 09:57 2023-03-28 UTC+2

Indicator analysis: Daily review of EUR/USD on March 28, 2023

The euro-dollar pair may move upward from the level of 1.0796 (closing of yesterday's daily candle) to 1.0835, the 61.8% pullback level (red dotted line). Upon reaching this level, continued

Stefan Doll 09:46 2023-03-28 UTC+2

Technical Analysis of GBP/USD for March 28, 2023

Technical Market Outlook: The GBP/USD pair has broken below the short-term trend line support and made a new local low at the level of 1.2189 and is currently moving

Sebastian Seliga 08:30 2023-03-28 UTC+2

Technical Analysis of EUR/USD for March 28, 2023

Technical Market Outlook: The EUR/USD pair has broken below the short-term trend line support (orange line on chart) and made a local low at the level of 1.0712. Since then

Sebastian Seliga 08:29 2023-03-28 UTC+2

Analysis of Gold for March 28,.2023 - Bear flag pattern and potential for the downside continuation

Technical analysis: Gold has been trading downside yesterday and I see potential for the downside continuation today. Due to the downside momentum in the background and the bear flag pattern

Petar Jacimovic 08:16 2023-03-28 UTC+2

Technical Analysis of Daily Price Movement of Silver Commodity Asset, Tuesday March 28, 2023.

After testing the 22,964 level which is a significant resistance level on the daily chart of Silver commodity assets, it seems that in the next few days Silver

Arief Makmur 08:13 2023-03-28 UTC+2
หากไม่สะดวกคุยในตอนนี้
ระบุคำถามไว้ได้ใน แชท.