empty
 
 
25.01.2023 10:02 AM
EURGBP Potential for Bullish Continuation towards recent swing high

This image is no longer relevant

Description :

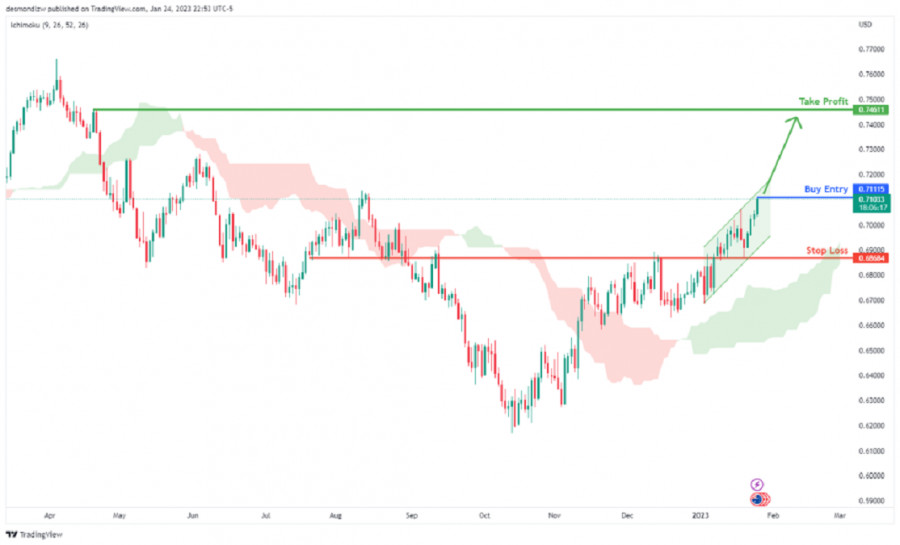
Looking at the H4 chart, my overall bias for EURGBP is bullish due to the current price crossing above the Ichimoku cloud, indicating a bullish market structure. Looking for a pullback buy entry at 0.87952, where the overlap support and 38.2% Fibonacci line s. Stop loss will be at 0.87219, where the recent swing low is. Take profit will be at 0.88970, where the previous swing high was.

Trading Recommendation

Entry: 0.87952

Reason for Entry: Overlap support and 38.2% Fibonacci line

Take Profit: 0.88970

Reason for Take Profit:

Previous swing high

Stop Loss: 0.87219

Reason for Stop Loss:

Recent swing low

EURGBP
Euro vs Great Britain Pound
Select timeframe
5
min
15
min
30
min
1
hour
4
hours
1
day
1
week
Start trade
Start trade
EURUSD, H4 | Potential Reversal from a key level?
The EUR/USD chart is displaying bearish momentum, indicating a potential drop from the multi-swing high resistance level at 1.0927, coinciding with a 78.60% Fibonacci retracement. The first support level at 1.0830, a multi-swing low support level, could be reached if the price falls. If the price c.
ผู้เขียน: Dean Leo
02:14 2023-03-31 UTC--4
1255
WTI, H4 | Potential bearish reversal?
WTI crude oil prices are currently bearish and may drop towards the first support at 71.15, while facing resistance at 74.07. Key support levels include a significant overlap support and an overlap support with a 78.60% Fibonacci retracement. Meanwhile, resistance levels include an overlap resistan.
ผู้เขียน: Dean Leo
02:13 2023-03-31 UTC--4
1135
DXY, H4 | Strong descending trendline ?
The DXY chart displays bearish momentum, with prices below a significant descending trendline. The first support level at 101.89, a swing low support, coincides with a 78.60% Fibonacci retracement level, making it a strong level to watch. The second support level at 100.82 is also a swing low suppo.
ผู้เขียน: Dean Leo
02:11 2023-03-31 UTC--4
1120
แสดงรายละเอียดเพิ่มเติม
  • Grand Choice
    Contest by
    InstaForex
    InstaForex always strives to help you
    fulfill your biggest dreams.
    เข้าร่วมการแข่งขัน
  • Chancy Deposit
    ฝากเงินในบัญชีของคุณใน $3,000 และรับ $8000 ไปเพิ่ม!
    ใน มีนาคม ทางเราได้ออก$8000 ภายในแคมเปญ Chancy Deposit !
    คว้าโอกาสที่จะชนะด้วยการฝากเงิน $3,000 ไปในบัญชีเทรด เมื่อทำตามเงื่อนไขนี้แล้ว คุณก็จะกลายเป็นผู้เข้าร่วมแคมเปญ
    เข้าร่วมการแข่งขัน
  • เทรดให้ดีแล้วคว้ารางวัล
    เติมเงินในบัญชีของคุณอย่างน้อย $500 สมัครเข้าร่วมการแข่งขัน และลุ้นรับรางวัลอุปกรณ์ติดต่อสื่อสารแบบพกพา
    เข้าร่วมการแข่งขัน
  • โบนัส 100%
    โอกาสพิเศษของคุณในการรับโบนัส 100% จากเงินฝากของคุณ
    รับโบนัส
  • โบนัส 55%
    สมัครรับโบนัส 55% สำหรับการฝากทุกครั้ง
    รับโบนัส
  • โบนัส 30%
    รับโบนัส 30% ทุกครั้งที่คุณเติมเงินในบัญชีของคุณ
    รับโบนัส

Recommended Stories

DXY, H4 | Strong descending trendline ?

The DXY chart displays bearish momentum, with prices below a significant descending trendline. The first support level at 101.89, a swing low support, coincides with a 78.60% Fibonacci retracement level

Dean Leo 08:11 2023-03-31 UTC+2

DXY, H4 | Strong descending trendline ?

The DXY index is currently displaying strong bearish momentum, trading below a significant descending trend line, indicating further potential for price drops. If the trend continues, the index could decline

Dean Leo 07:50 2023-03-30 UTC+2

US500, H4 | Ascending trendline ?

US500 chart is bullish, with price above a major ascending trend line, potential for bullish continuation to first resistance. First support level at 3903.06 is a strong multi-swing low support

Dean Leo 08:04 2023-03-28 UTC+2

WIT(OIL), Day | Strong descending trendline ?

WTI oil prices have turned bearish as they fell below a crucial support level. The chart indicates that the momentum has shifted to the downside, signaling a potential further decline

Dean Leo 07:46 2023-03-27 UTC+2

USDJPY, H4 | Strong descending trendline ?

The USD/JPY pair currently has a weak momentum with low confidence due to its position below a major descending trend line, indicating possible bearish momentum. Breaking off from the first

Dean Leo 06:07 2023-03-24 UTC+2

USDCAD, H4 | Respected descending trendline ?

The charts indicate that the USD/CAD currency pair is currently experiencing a bearish momentum, with price situated below a significant descending trend line. As such, it is likely that

Dean Leo 06:55 2023-03-23 UTC+2

USD/JPY, H4 | Break out trendline?

The USD/JPY chart currently reflects a bullish momentum as it is trading above a significant ascending trend line, indicating potential for further bullish movement. In case the price manages

Dean Leo 06:37 2023-03-22 UTC+2

AUDUSD, H4 | Break out trendline?

Currently, the AUD/USD chart reflects bullish momentum, indicated by the break above a descending resistance line and the crossing above the Ichimoku cloud. The potential for continued bullish movement towards

Dean Leo 07:53 2023-03-21 UTC+2

EURUSD, Day | Potential reversel?

The EUR/USD pair has bullish momentum and may move towards the 1st resistance level. Pullback support at 1.0478, coinciding with the 38.20% Fibonacci retracement level, is currently supporting the price

Dean Leo 09:44 2023-03-20 UTC+2

GBPUSD, H4 | Potential reversel from trendline?

The GBP/USD chart currently exhibits bearish momentum, as the price remains below a significant descending trend line. This indicates that the currency pair may undergo further downward pressure

Dean Leo 08:05 2023-03-17 UTC+2
หากไม่สะดวกคุยในตอนนี้
ระบุคำถามไว้ได้ใน แชท.