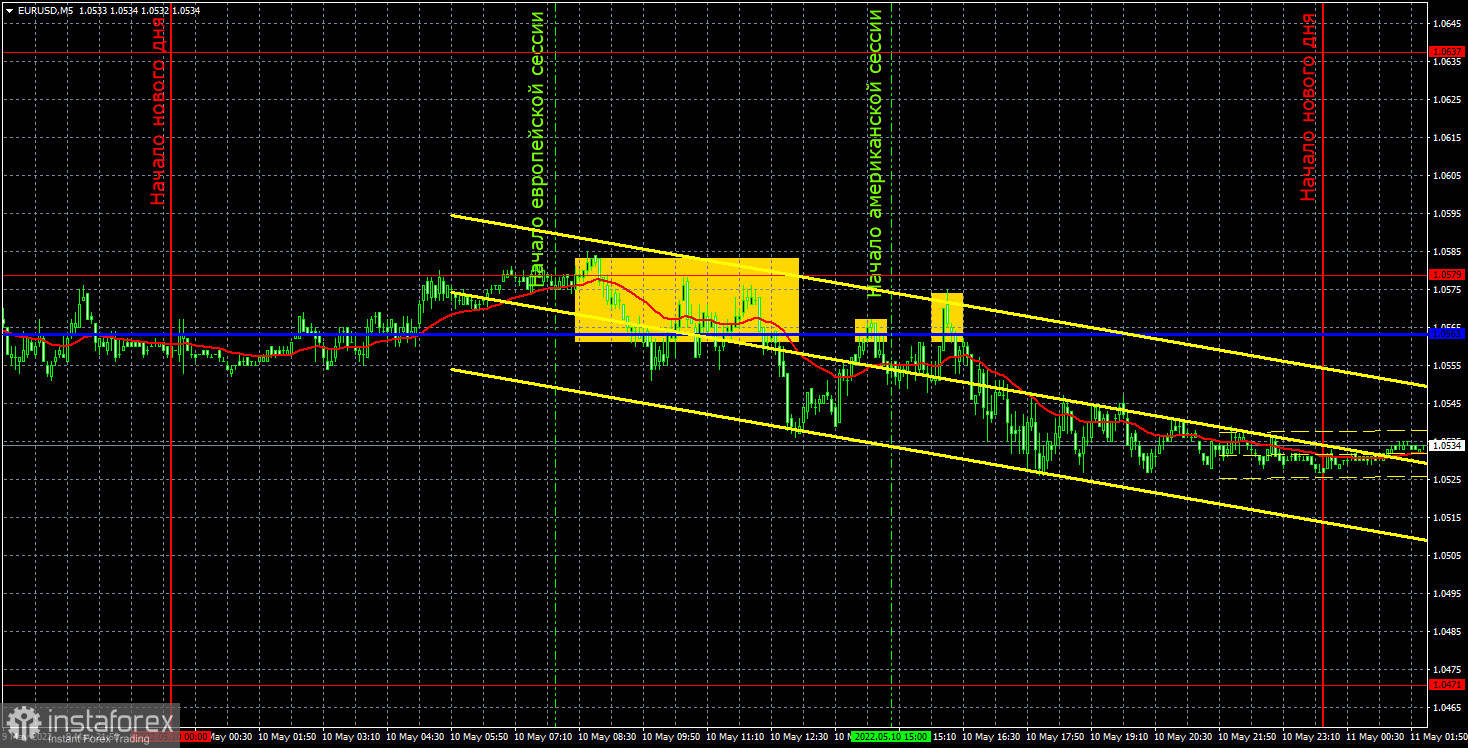
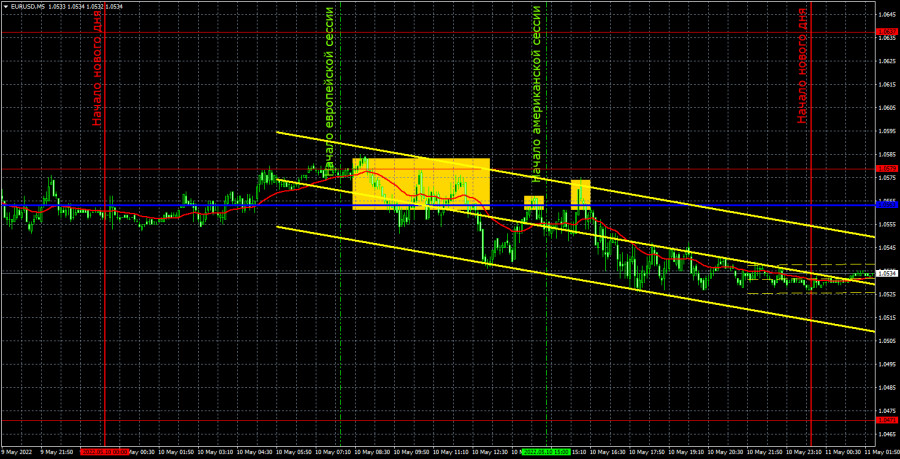
EUR/USD 5M
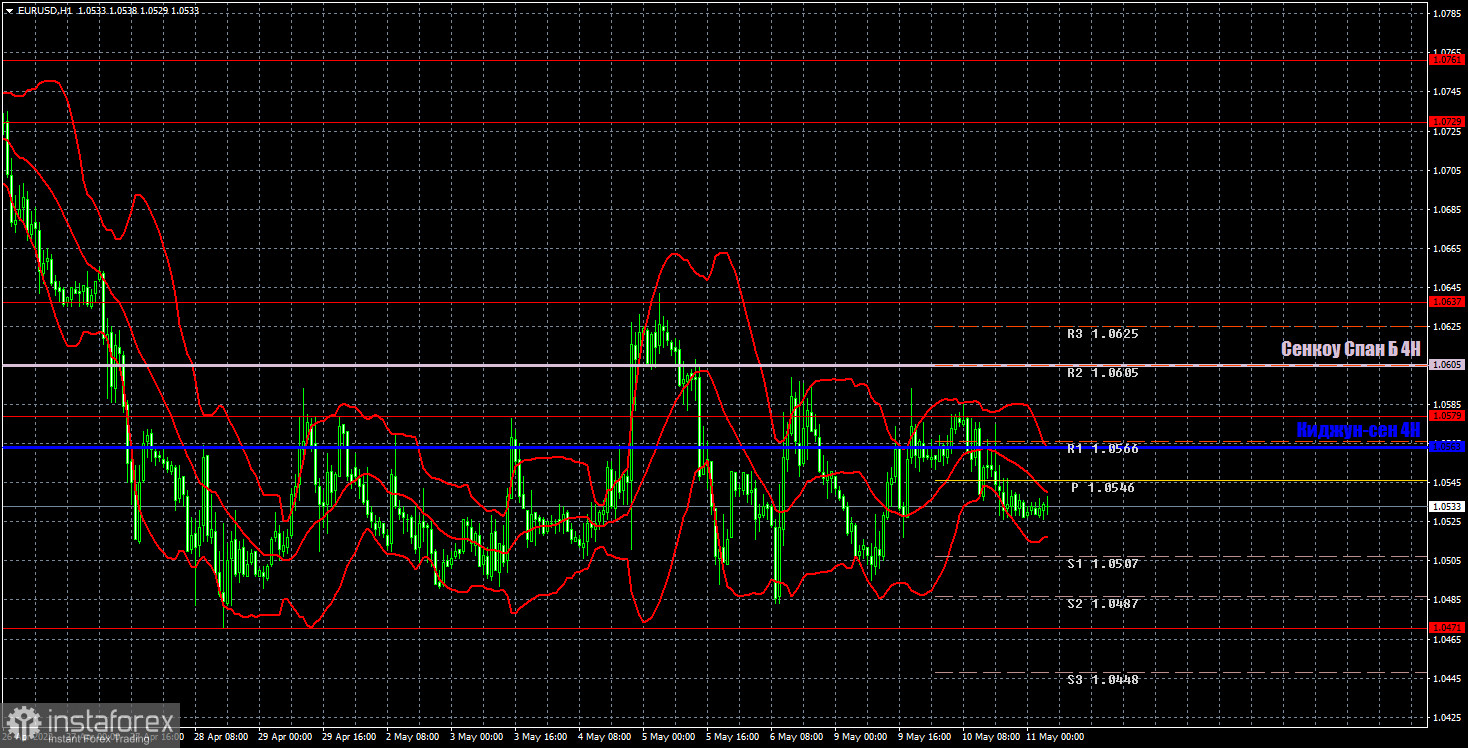
The EUR/USD pair made another attempt to correct on Tuesday. It was unsuccessful again. It is clearly seen on the hourly timeframe that the pair has been spending the last weeks between the levels of 1.0471 and 1.0579. It does not work out the boundaries of this channel very accurately, often making either false breakouts or not reaching them by 10-20 points. However, such flats also exist, so now it is very difficult to trade even on a rebound from the borders. Only one more or less significant report was published yesterday - the index of business sentiment in the ZEW Institute for the European Union. Its value remained negative, which perfectly reflects the mood of managers. However, this report did not affect the pair's movement in any way - it still remains flat. Thus, traders now only have to wait for the flat to end. In principle, after a long and strong trend movement, a flat is logical. An upward correction would be more logical, but there are no bulls on the market now.
Several trading signals were formed despite the flat. During the European trading session, the pair bounced first from the area consisting of the level of 1.0579 and the critical line. There are 16 points between them, so they should be considered an area. After a rebound from it, two more sell signals were formed in the form of rebounds from Kijun-sen. There are only three sell signals. There should have been two short positions open. The first deal was closed by Stop Loss at breakeven (the pair went down about 20 points), the second deal could bring a profit of about 20 points, since the price could not return to the critical line until the very evening - the deal had to be closed manually.
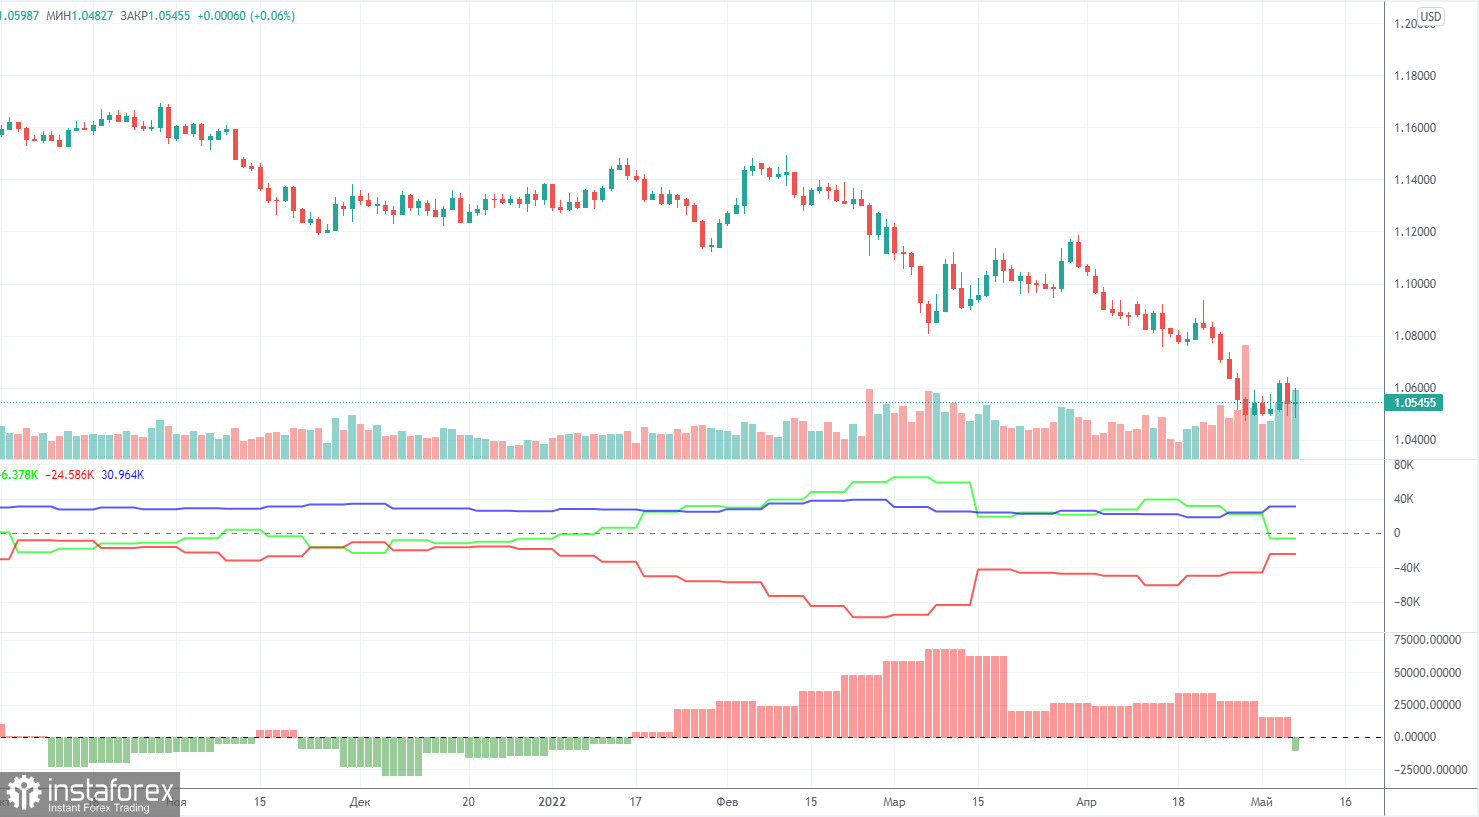
COT report:
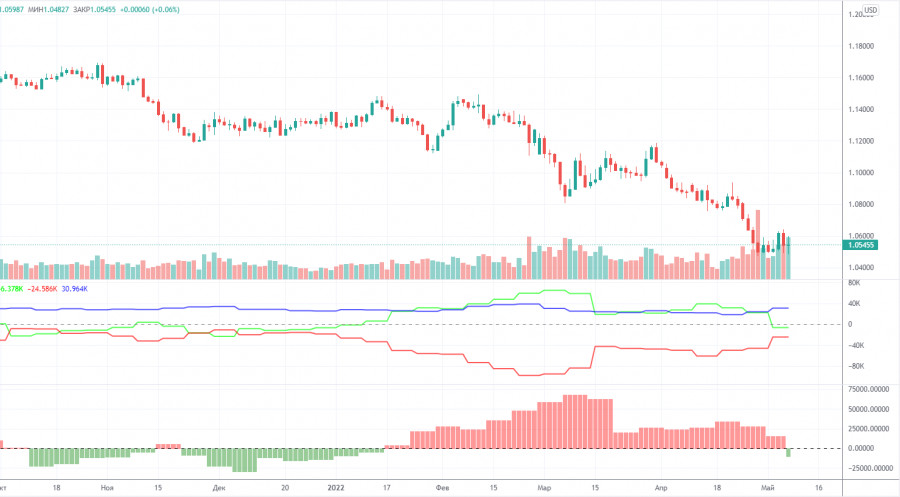
The latest Commitment of Traders (COT) reports on the euro raised more questions than they answered! But finally the situation began to change and now the COT reports more or less reflect the real picture of what is happening on the market, as the mood of the non-commercial group has become bearish. The number of long positions decreased by 14,500 during the reporting week, while the number of shorts in the non-commercial group increased by 14,000. Thus, the net position decreased by 28,500 contracts per week. This means that the bullish mood has changed to bearish, as the number of short positions now exceeds the number of non-commercial traders' long positions by 6,000. However, what happened in the last reporting week is a double-edged sword. On the one hand, COT reports now reflect what is happening on the market. On the other hand, if now the demand for the euro has also begun to fall, then we can expect another new fall in this currency. Recall that in recent weeks, professional traders, oddly enough, maintained a bullish mood and bought the euro more than sold. And even in this scenario, the euro fell like a stone. What will happen now, when the major players have begun to sell the euro? Demand for the dollar remains high, demand for the euro falls. Thus, it is quite reasonable now to expect a new decline in the euro/dollar pair. Moreover, the reaction to the Federal Reserve's hawkish meeting was not quite adequate.
We recommend to familiarize yourself with:
Overview of the EUR/USD pair. May 11. A dead end is a dead end. International experts do not see opportunities to end the conflict between Ukraine and Russia.
Overview of the GBP/USD pair. May 11. Will the report on US inflation affect the position of the dollar?
Forecast and trading signals for GBP/USD on May 11. Detailed analysis of the movement of the pair and trading transactions.
EUR/USD 1H
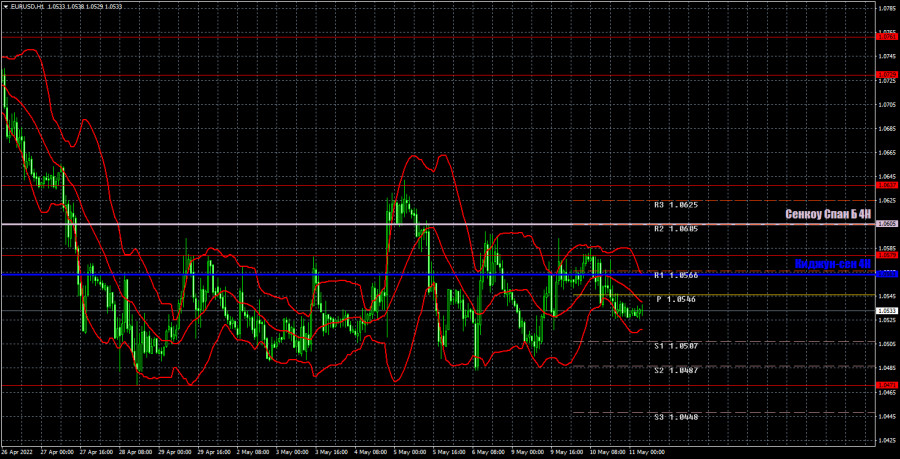
You can clearly see on the hourly timeframe that the pair has been desperately trying to correct in recent weeks, but on Tuesday it began a new round of downward movement inside the horizontal channel. In principle, the pair can now spend as much time as they want inside the horizontal channel. From a technical point of view, a correction continues to brew, but since there are no bulls on the market, the European currency can easily and freely continue to fall after a pause. We highlight the following levels for trading on Wednesday - 1.0340-1.0369, 1.0471, 1.0579, 1.0637, 1.0729, as well as Senkou Span B (1.0605) and Kijun-sen (1 .0563). Ichimoku indicator lines can move during the day, which should be taken into account when determining trading signals. There are also secondary support and resistance levels, but no signals are formed near them. Signals can be "rebounds" and "breakthrough" extreme levels and lines. Do not forget about placing a Stop Loss order at breakeven if the price has gone in the right direction for 15 points. This will protect you against possible losses if the signal turns out to be false. On May 11, the speech of European Central Bank President Christine Lagarde is scheduled in the European Union, which can be very interesting. An even more important report on inflation will be released in the US today. We believe that there will be volatility, movements and market reaction to events, but it is far from certain that they will help the pair get out of the horizontal channel.
Explanations for the chart:
Support and Resistance Levels are the levels that serve as targets when buying or selling the pair. You can place Take Profit near these levels.
Kijun-sen and Senkou Span B lines are lines of the Ichimoku indicator transferred to the hourly timeframe from the 4-hour one.
Support and resistance areas are areas from which the price has repeatedly rebounded off.
Yellow lines are trend lines, trend channels and any other technical patterns.
Indicator 1 on the COT charts is the size of the net position of each category of traders.
Indicator 2 on the COT charts is the size of the net position for the non-commercial group.