empty
 
 
02.02.2023 08:10 PM
February 2, 2023 : EUR/USD daily technical review and trading opportunities.

This image is no longer relevant

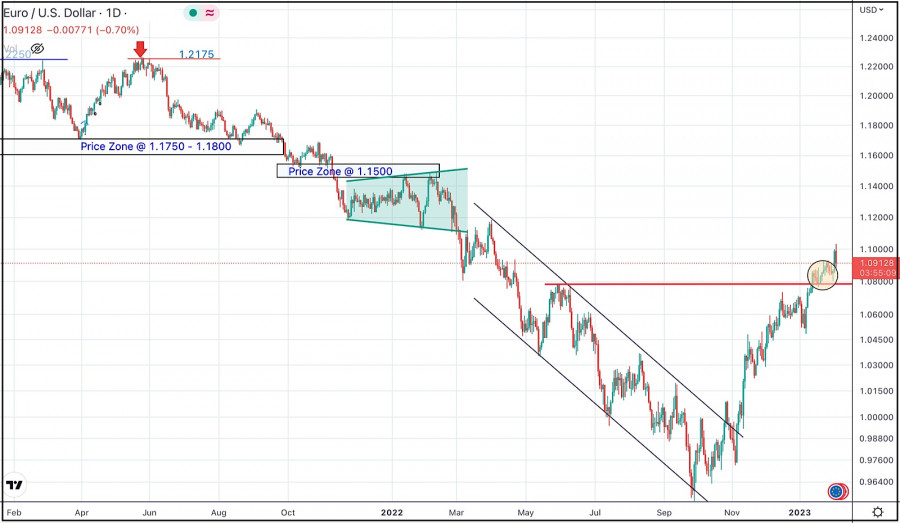
The price zone around 1.1500 has applied significant SELLING pressure upon the previous ascending movement towards it.

Shortly after, the EUR/USD pair has been moving downwards reaching the price levels of 1.0850, 1.0400, 1.0000 and recently 0.9600.

The market has remained under buying pressure until a plateau level occurred around the key-zone around 1.0800-1.0850.

In the mean time, any downside movement towards 1.0300 should be watched for BUYING pressure where a new upside movement can be established.

EURUSD
Euro vs US Dollar
Select timeframe
5
min
15
min
30
min
1
hour
4
hours
1
day
1
week
Start trade
Start trade
  • Grand Choice
    Contest by
    InstaForex
    InstaForex always strives to help you
    fulfill your biggest dreams.
    เข้าร่วมการแข่งขัน
  • Chancy Deposit
    ฝากเงินในบัญชีของคุณใน $3,000 และรับ $1000 ไปเพิ่ม!
    ใน เมษายน ทางเราได้ออก$1000 ภายในแคมเปญ Chancy Deposit !
    คว้าโอกาสที่จะชนะด้วยการฝากเงิน $3,000 ไปในบัญชีเทรด เมื่อทำตามเงื่อนไขนี้แล้ว คุณก็จะกลายเป็นผู้เข้าร่วมแคมเปญ
    เข้าร่วมการแข่งขัน
  • เทรดให้ดีแล้วคว้ารางวัล
    เติมเงินในบัญชีของคุณอย่างน้อย $500 สมัครเข้าร่วมการแข่งขัน และลุ้นรับรางวัลอุปกรณ์ติดต่อสื่อสารแบบพกพา
    เข้าร่วมการแข่งขัน
  • โบนัส 100%
    โอกาสพิเศษของคุณในการรับโบนัส 100% จากเงินฝากของคุณ
    รับโบนัส
  • โบนัส 55%
    สมัครรับโบนัส 55% สำหรับการฝากทุกครั้ง
    รับโบนัส
  • โบนัส 30%
    รับโบนัส 30% ทุกครั้งที่คุณเติมเงินในบัญชีของคุณ
    รับโบนัส

Recommended Stories

Technical analysis of AUD/USD for March 31, 2023

The AUD/USD pair has faced strong resistances at the levels of 0.6724 because support had become resistance since a week. So, the strong resistance has already formed at the level

Mourad El Keddani 01:12 2023-04-01 UTC+2

Technical analysis of EUR/USD for March 31, 2023

The EUR/USD pair didn't make any significant movements yesterday. There are no changes in our technical outlook. The bias remains bullish in the nearest term testing 1.0903or higher. Immediate support

Mourad El Keddani 01:03 2023-04-01 UTC+2

March 31, 2023 : EUR/USD daily technical review and trading opportunities.

The price level of 1.0930 remained a significant resistance level to offer SELL opportunities until the recent upside movement temporarily extended up to 1.1000. That's why, the next target

Mohamed Samy 20:03 2023-03-31 UTC+2

March 31, 2023 : EUR/USD Intraday technical analysis and trading plan.

Price action around the key-level of (1.0550-1.0600) was quite bullish. That's why, further bullish continuation towards 1.0800 was demonstrated. Moreover, more bullish advancement towards the nearest supply zone around 1.1150-1.1200

Mohamed Samy 20:02 2023-03-31 UTC+2

March 31, 2023 : GBP/USD Intraday technical analysis and significant key-levels.

The GBPUSD bulls failed to record a new high. Instead, a descending high was established around the same price level. Bearish pullback pursued towards the price levels of 1.1800. This

Mohamed Samy 20:01 2023-03-31 UTC+2

NZD/USD standing below strong upside obstacle

The NZD/USD pair is located at 0.6263 at the time of writing. As you can see on the H1 chart, it stands below 0.6273 - 0.6291 supply zone (upside obstacle)

Ralph Shedler 18:58 2023-03-31 UTC+2

Trading Signal for GOLD (XAU/USD) for March 31, 2023: sell below $1,979 (21 SMA - symmetrical triangle)

In the chart above, we can observe a symmetrical triangle formation. The break below 1,960 could confirm a bearish movement in the short. In the medium term, the price could

Dimitrios Zappas 16:24 2023-03-31 UTC+2

USD/CAD: upside reversal needs confirmation

The USD/CAD pair crashed in the last hours and it seems determined to reach and retest the near-term support levels before developing a new bullish momentum. After its massive drop

Ralph Shedler 15:59 2023-03-31 UTC+2

Monthly USDJPY analysis and the Inverted head and shoulders pattern

In previous posts we have talked about the major bullish pattern of the inverted head and shoulders pattern in USDJPY. We have posted the monthly chart several times even before

Alexandros Yfantis 13:56 2023-03-31 UTC+2

Technical analysis on EURUSD for March 31st, 2023.

EURUSD is trading around 1.0886. Price is under pressure today. Price has so far respected the key support neckline and cancelled the bearish Head and Shoulders pattern. At the same

Alexandros Yfantis 12:01 2023-03-31 UTC+2
หากไม่สะดวกคุยในตอนนี้
ระบุคำถามไว้ได้ใน แชท.