empty
 
 
03.02.2023 01:39 PM
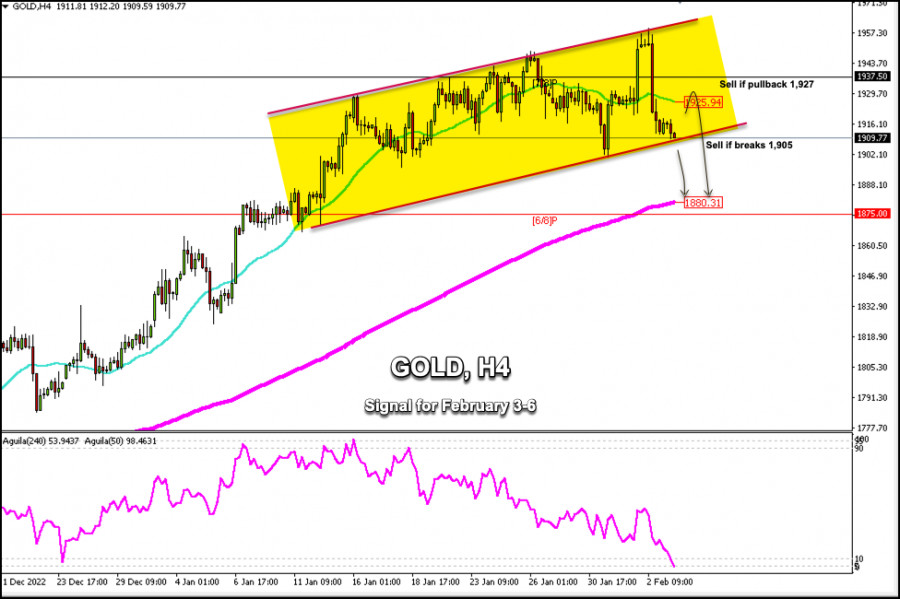
Trading Signal for Gold (XAU/USD) for February 3-6, 2023: sell in case of pullback at $1,927 (21 SMA - 7/8 Murray)

This image is no longer relevant

Early in an American session, gold is trading around 1,909.77. We can see on the 4-hour chart that it is trading below the 21 SMA (1,925) and below the 7/8 Murray (1,937).

Yesterday, gold made a strong technical correction after reaching a new high around the area of 1,959. In our previous analysis, we noted that gold touched the top of the bullish channel and a technical correction followed later. We expected gold to go ahead with this sharp decline.

In case XAU/USD breaks below the psychological level of 1,900, it could continue to fall towards the 200 EMA located at 1,880 and could even fall towards the 6/8 Murray at 1,875.

Conversely, in case there is a pullback towards the weekly pivot point or the daily pivot point located around 1,925 to 1,929, it will be considered an opportunity to resume selling with targets at 1,910 and 1,880 (200 EMA).

For gold to resume its bullish cycle, we should wait for consolidation above 1,930. Then, it could reach the 1,959 zone again. It could even reach the weekly resistance at 1,966.

Our trading plan for the next few hours is to sell gold if it trades below 1,927 with targets at 1,900 and 1,875 (6/8 Murray). The eagle indicator is giving a negative signal and gold is likely to find solid support and we could wait for a technical bounce and then sell.

EURUSD
Euro vs US Dollar
Select timeframe
5
min
15
min
30
min
1
hour
4
hours
1
day
1
week
Start trade
Start trade
  • Grand Choice
    Contest by
    InstaForex
    InstaForex always strives to help you
    fulfill your biggest dreams.
    เข้าร่วมการแข่งขัน
  • Chancy Deposit
    ฝากเงินในบัญชีของคุณใน $3,000 และรับ $8000 ไปเพิ่ม!
    ใน มีนาคม ทางเราได้ออก$8000 ภายในแคมเปญ Chancy Deposit !
    คว้าโอกาสที่จะชนะด้วยการฝากเงิน $3,000 ไปในบัญชีเทรด เมื่อทำตามเงื่อนไขนี้แล้ว คุณก็จะกลายเป็นผู้เข้าร่วมแคมเปญ
    เข้าร่วมการแข่งขัน
  • เทรดให้ดีแล้วคว้ารางวัล
    เติมเงินในบัญชีของคุณอย่างน้อย $500 สมัครเข้าร่วมการแข่งขัน และลุ้นรับรางวัลอุปกรณ์ติดต่อสื่อสารแบบพกพา
    เข้าร่วมการแข่งขัน
  • โบนัส 100%
    โอกาสพิเศษของคุณในการรับโบนัส 100% จากเงินฝากของคุณ
    รับโบนัส
  • โบนัส 55%
    สมัครรับโบนัส 55% สำหรับการฝากทุกครั้ง
    รับโบนัส
  • โบนัส 30%
    รับโบนัส 30% ทุกครั้งที่คุณเติมเงินในบัญชีของคุณ
    รับโบนัส

Recommended Stories

NZDUSD, H4 | Potential Bearish Reversal

The NZD/USD chart currently displays a bearish momentum, with price below a major descending trend line and the bearish Ichimoku cloud. The potential price movement could involve a bearish reaction

Dean Leo 09:46 2023-03-20 UTC+2

XAUUSD, Day | Potential Bearish Reversal from?

Gold prices have been experiencing a bearish trend for some time now, which is reinforced by a major descending trend line on the XAU/USD chart. The current price could potentially

Dean Leo 09:45 2023-03-20 UTC+2

Analysis of Gold for March 20,.2023 - Extreme bullish condiiton, potential for the further upside movement

Technical analysis: Gold has been trading upside this morning and I found that Gold is the very strong upside momentum and there is the chance for the multi year highs

Petar Jacimovic 09:25 2023-03-20 UTC+2

USD/CHF analysis for March 20, 2023 - Breakout of the triangle pattern to the upside

Technical analysis: USD/CHF has been trading upside this morning and I found the breakout of the triangle pattern in the background. Due to the breakout of the tight triangle

Petar Jacimovic 09:18 2023-03-20 UTC+2

Indicator analysis: Daily review of GBP/USD on March 20, 2023

The pound-dollar pair may move upward from the level of 1.2176 (closing of Friday's daily candle) to 1.2273, the 76.4% pullback level (blue dotted line). Upon reaching this level

Stefan Doll 09:17 2023-03-20 UTC+2

Indicator analysis: Daily review of EUR/USD on March 20, 2023

The euro-dollar pair may move upward from the level of 1.0666 (closing of Friday's daily candle) to 1.0713, the 38.2% pullback level (red dotted line). When testing this level

Stefan Doll 09:05 2023-03-20 UTC+2

Technical Analysis of GBP/USD for March 20, 2023

Technical Market Outlook: The GBP/USD pair has been seen testing the last swing high located at the level of 1.2202. The bulls had violated the level of 1.2135 which

Sebastian Seliga 08:45 2023-03-20 UTC+2

Technical Analysis of EUR/USD for March 20, 2023

Technical Market Outlook: The EUR/USD pair has been seen moving up towards the last swing high located at 1.0760 and the recent local high was made at the level

Sebastian Seliga 08:45 2023-03-20 UTC+2

Technical analysis of GBP/USD for March 20-26, 2023

GBP/USD may continue an upward movement this week, starting from the closing of last week's candle to the upper fractal. Upon testing this level, the pair will head towards

Stefan Doll 08:36 2023-03-20 UTC+2

Technical analysis of EUR/USD for March 20-26, 2023

EUR/USD is likely to continue its upward movement this week, rising from the closing of the last weekly candle to the 50.0% retracement level. Upon reaching this price, the pair

Stefan Doll 08:34 2023-03-20 UTC+2
หากไม่สะดวกคุยในตอนนี้
ระบุคำถามไว้ได้ใน แชท.