empty
 
 
06.02.2023 06:11 PM
Technical analysis on EURUSD for February 6th, 2023.

This image is no longer relevant

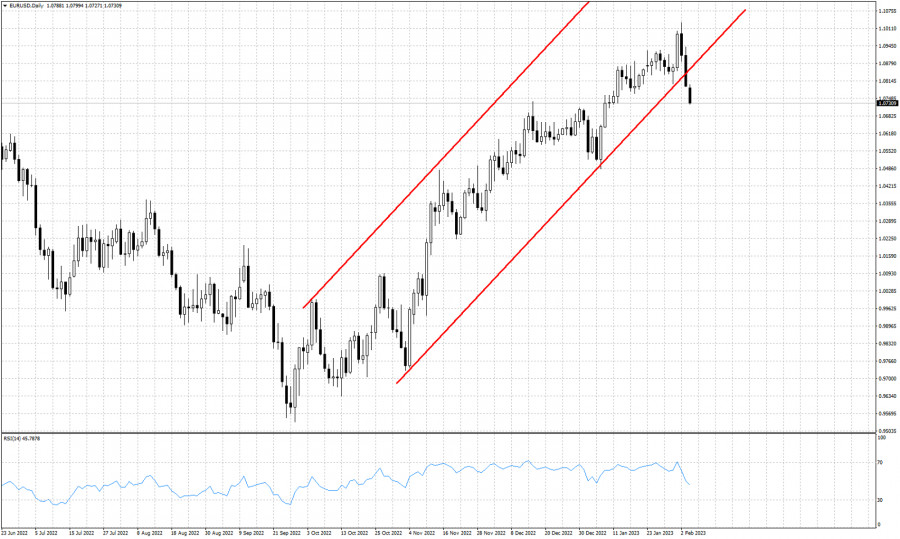
Red lines- bullish channel

EURUSD is trading around 1.0740. Short-term trend has changed to bearish as price has exited the bullish channel it was in. Bulls were warned last week that a pull back was imminent. Our Ichimoku cloud indicator analysis also warned of the trend change in the near term. EURUSD is making new lower lows today losing in just three sessions what it gained in 3 weeks. The entire upward move from 0.9536 is most probably over. Horizontal support is found at 1.07-1.0710 near today's lows. Next support is at 1.0685 where we find the 23.6% Fibonacci retracement of the entire upward movement. Failure to hold above 1.0685-1.07 will lead EURUSD even lower towards 1.0470 where we find the 38% Fibonacci retracement. This is not the time to be bullish EURUSD as we believe that at least a major pull back has started.

EURUSD
Euro vs US Dollar
Select timeframe
5
min
15
min
30
min
1
hour
4
hours
1
day
1
week
Start trade
Start trade
  • Grand Choice
    Contest by
    InstaForex
    InstaForex always strives to help you
    fulfill your biggest dreams.
    เข้าร่วมการแข่งขัน
  • Chancy Deposit
    ฝากเงินในบัญชีของคุณใน $3,000 และรับ $8000 ไปเพิ่ม!
    ใน มีนาคม ทางเราได้ออก$8000 ภายในแคมเปญ Chancy Deposit !
    คว้าโอกาสที่จะชนะด้วยการฝากเงิน $3,000 ไปในบัญชีเทรด เมื่อทำตามเงื่อนไขนี้แล้ว คุณก็จะกลายเป็นผู้เข้าร่วมแคมเปญ
    เข้าร่วมการแข่งขัน
  • เทรดให้ดีแล้วคว้ารางวัล
    เติมเงินในบัญชีของคุณอย่างน้อย $500 สมัครเข้าร่วมการแข่งขัน และลุ้นรับรางวัลอุปกรณ์ติดต่อสื่อสารแบบพกพา
    เข้าร่วมการแข่งขัน
  • โบนัส 100%
    โอกาสพิเศษของคุณในการรับโบนัส 100% จากเงินฝากของคุณ
    รับโบนัส
  • โบนัส 55%
    สมัครรับโบนัส 55% สำหรับการฝากทุกครั้ง
    รับโบนัส
  • โบนัส 30%
    รับโบนัส 30% ทุกครั้งที่คุณเติมเงินในบัญชีของคุณ
    รับโบนัส

Recommended Stories

Technical analysis on EURUSD for March 31st, 2023.

EURUSD is trading around 1.0886. Price is under pressure today. Price has so far respected the key support neckline and cancelled the bearish Head and Shoulders pattern. At the same

Alexandros Yfantis 12:01 2023-03-31 UTC+2

Technical analysis on NZDUSD for March 31st, 2023.

NZDUSD is trading around 0.6260. Price recently tested the black neckline resistance for the 4th time and it seems it is getting rejected once again. In the near term price

Alexandros Yfantis 11:55 2023-03-31 UTC+2

Technical analysis on Gold for March 31st, 2023.

Gold price is trading around $1,979. Price remains inside the triangle pattern we mentioned in our previous analysis. Price has reached the short-term resistance level of $1,983 where we find

Alexandros Yfantis 11:52 2023-03-31 UTC+2

Forecast for EUR/USD on March 31, 2023

On Thursday, the EUR/USD pair resumed its upward trend and secured above the corrective level of 200% (1.0861). As a result, the European currency can now continue to rise toward

Samir Klishi 11:26 2023-03-31 UTC+2

Forex forecast 03/31/2023 EUR/USD, GBP/USD, GBP/JPY, Oil and Bitcoin from Sebastian Seliga

Let's take a look at the technical picture of EUR/USD, GBP/USD, GBP/JPY, Oil and Bitcoin

Sebastian Seliga 11:04 2023-03-31 UTC+2

Forecast for GBP/USD on March 31, 2023

The GBP/USD pair secured above the level of 1.2342 on Thursday, and the hourly chart shows that development is continuing toward the level of 1.2432. Let me tell you that

Samir Klishi 11:02 2023-03-31 UTC+2

GBP/USD: upside seems over

The GBP/USD pair is trading in the red at the time of writing and it seems very heavy, so more declines are in cards. After its amazing growth, a sell-off

Ralph Shedler 10:20 2023-03-31 UTC+2

Indicator analysis: Daily review of GBP/USD on March 31, 2023

The pound-dollar pair may move down from the level of 1.2382 (closing of yesterday's daily candle) to 1.2352, the 85.4% pullback level (blue dotted line). Upon reaching this level

Stefan Doll 09:55 2023-03-31 UTC+2

Video market update for March 31, 2023

Potential for the downside movement on Silver and BTCUSD

Petar Jacimovic 09:51 2023-03-31 UTC+2

Indicator analysis: Daily review of EUR/USD on March 31, 2023

The euro-dollar pair may move down from the level of 1.0904 (closing of yesterday's daily candle) to 1.0869, the 14.6% pullback level (yellow dotted line). When testing this level

Stefan Doll 09:45 2023-03-31 UTC+2
หากไม่สะดวกคุยในตอนนี้
ระบุคำถามไว้ได้ใน แชท.