empty
 
 
07.02.2023 04:16 PM
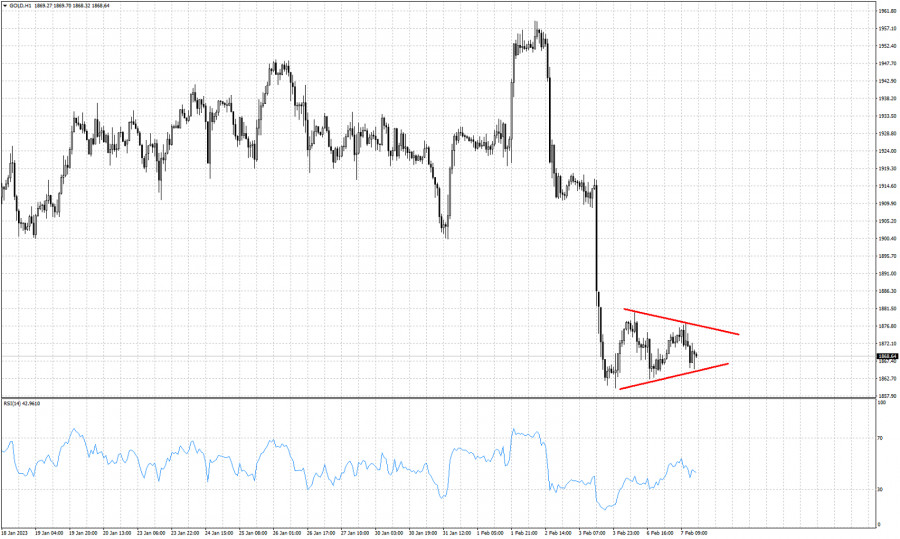
Short-term triangle pattern in Gold.

This image is no longer relevant

Red lines- triangle pattern

Gold price is trading around $1,870. Short-term trend is bearish after the recent break down from last week. Price is now forming a triangle pattern clearly visible in the 1 hour chart. Most probable outcome is for price to break to the downside as previous trend is bearish. The lower triangle boundary provides support at $1,864. A break below this level will push Gold price towards $1,840. The upper triangle pattern provides resistance at $1,875, A break above this level could push Gold towards $1,900.

EURUSD
Euro vs US Dollar
Select timeframe
5
min
15
min
30
min
1
hour
4
hours
1
day
1
week
Start trade
Start trade
  • Grand Choice
    Contest by
    InstaForex
    InstaForex always strives to help you
    fulfill your biggest dreams.
    เข้าร่วมการแข่งขัน
  • Chancy Deposit
    ฝากเงินในบัญชีของคุณใน $3,000 และรับ $8000 ไปเพิ่ม!
    ใน มีนาคม ทางเราได้ออก$8000 ภายในแคมเปญ Chancy Deposit !
    คว้าโอกาสที่จะชนะด้วยการฝากเงิน $3,000 ไปในบัญชีเทรด เมื่อทำตามเงื่อนไขนี้แล้ว คุณก็จะกลายเป็นผู้เข้าร่วมแคมเปญ
    เข้าร่วมการแข่งขัน
  • เทรดให้ดีแล้วคว้ารางวัล
    เติมเงินในบัญชีของคุณอย่างน้อย $500 สมัครเข้าร่วมการแข่งขัน และลุ้นรับรางวัลอุปกรณ์ติดต่อสื่อสารแบบพกพา
    เข้าร่วมการแข่งขัน
  • โบนัส 100%
    โอกาสพิเศษของคุณในการรับโบนัส 100% จากเงินฝากของคุณ
    รับโบนัส
  • โบนัส 55%
    สมัครรับโบนัส 55% สำหรับการฝากทุกครั้ง
    รับโบนัส
  • โบนัส 30%
    รับโบนัส 30% ทุกครั้งที่คุณเติมเงินในบัญชีของคุณ
    รับโบนัส

Recommended Stories

March 24, 2023 : EUR/USD daily technical review and trading opportunities.

The price level of 1.0800 remained a significant resistance level to offer SELL opportunities until the current upside movement was expressed. The next target is located around 1.1000 where

Mohamed Samy 16:55 2023-03-24 UTC+2

March 24, 2023 : EUR/USD Intraday technical analysis and trading plan.

Price action around the key-level of (1.0550-1.0600) was quite bullish. That's why, further bullish continuation towards 1.0800 was demonstrated. Moreover, more bullish advancement towards the nearest supply zone around 1.1150-1.1200

Mohamed Samy 16:54 2023-03-24 UTC+2

March 24, 2023 : GBP/USD Intraday technical analysis and significant key-levels.

The GBPUSD bulls failed to record a new high above 1.2200. Instead, a descending high was established around the same price level. Bearish pullback pursued towards the price levels

Mohamed Samy 16:53 2023-03-24 UTC+2

GBP/USD: reversal pattern activated

The GBP/USD pair crashed in the short term as the Dollar Index rebounded. Yesterday, I talked about exhausted buyers and about a Rising Wedge pattern. The pair's trading at 1.2225

Ralph Shedler 16:48 2023-03-24 UTC+2

Trading Signal for USD/JPY for March 24 - 27, 2023: buy above 130.10 (3/8 Murray - rebound)

Early in the US session, the Japanese Yen is trading around 130.10 bouncing after reaching a low around 129.62, the level which coincides with 3/8 Murray (129.68). Japanese yen like

Dimitrios Zappas 15:14 2023-03-24 UTC+2

EUR/USD: technical analysis on March 24, 2023

Hello, dear traders! On Thursday, EUR/USD reversed to the downside and almost approached the lower line of the ascending trend corridor, which indicates a bullish bias. Consolidation below the corridor

Samir Klishi 11:25 2023-03-24 UTC+2

GBP/USD: technical analysis on March 24, 2023. BoE raises rates for 11th time

Hello, dear traders! On the 1-hour chart, GBP/USD bounced off 1.2342, reversed to the downside, and headed toward 1.2238 and the lower limit of the ascending corridor. This line illustrates

Samir Klishi 11:25 2023-03-24 UTC+2

Forex forecast 03/24/2023 GBP/USD, USD/CHF, USD/CAD and Bitcoin from Sebastian Seliga

Let's take a look at the technical picture of GBP/USD, USD/CHF, USD/CAD and Bitcoin

Sebastian Seliga 09:59 2023-03-24 UTC+2

Video market update for March 24, 2023

Potential for the rally on USD/JPY

Petar Jacimovic 09:35 2023-03-24 UTC+2

USD/JPY analysis for March 24, 2023 - Potential for the rally

Technical analysis: USD/JPY has been trading downside in the background but I found falling wedge pattern in creation and potential upside movement. Due to potential downside exhaustion and bull crosses

Petar Jacimovic 09:35 2023-03-24 UTC+2
หากไม่สะดวกคุยในตอนนี้
ระบุคำถามไว้ได้ใน แชท.