empty
 
 
30.11.2022 01:09 PM
EUR/USD and GBP/USD trading plan and analysis for beginners on November 30, 2022

Economic calendar on November 29

Yesterday, the UK posted data on mortgage approvals and net lending to individuals. The data came out worse than expected. The number of approved mortgage loans was 58,000 against 65,000 a month earlier, while the figure was forecasted at 60,000. The volume of mortgage lending amounted to only £3.97 billion, while last month it was £5.88 billion. All indications confirm that the mortgage market is declining along with the real estate market. These factors are putting pressure on the industry.

As a result, bears put significant pressure on the British pound.

Overview of technical charts on November 29

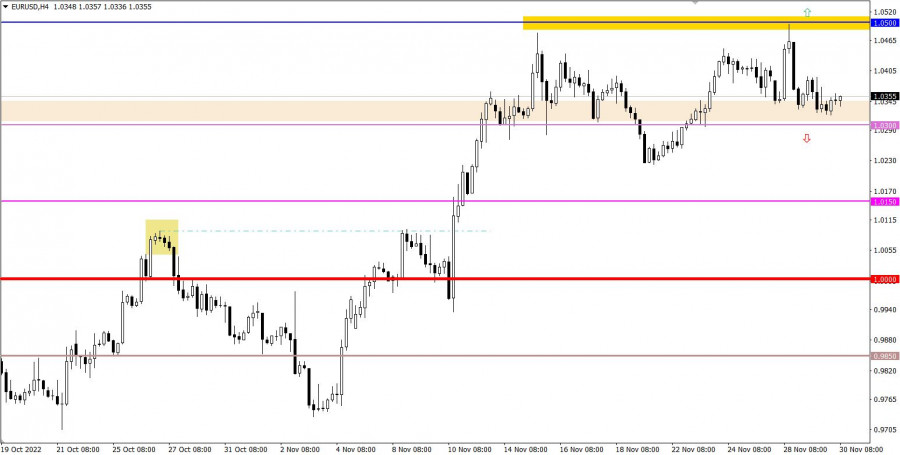
Yesterday, the EUR/USD pair declined slightly. The price approached the support level of 1.0300.

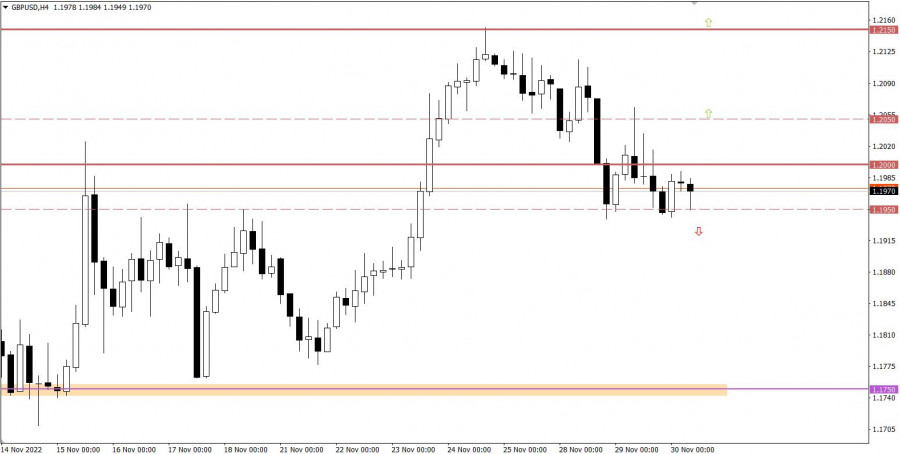
During the previous trading day, the GBP/USD pair was hovering near the psychologically important area of 1.1950-1.2000. This confirmed the fact that traders were considering short positions on the British pound.

This image is no longer relevant

Economic calendar on November 30

Today, the market expects important statistics on inflation in the euro area. The consumer price growth is expected to slow down to 10.3% from 10.6%. If these expectations are confirmed, the euro might experience much more pressure. It means that the ECB may consider slowing the pace of interest rate hikes following the Fed's steps.

Timing

EU Consumer Price Index – 10:00 GMT

Trading plan for EUR/USD on November 30

Currently, the pair is trading between 1.0300 and 1.0500. It can be assumed that if the price settles beyond one of these levels on the 4-hour chart, it will indicate the trend in the market. Before that, one may open positions on rebounds.

This image is no longer relevant

Trading plan for GBP/USD on November 30

The price needs to fix below 1.1950 on the 4-hour chart to continue the current downtrend. This downward movement started at the end of the last week. Following this scenario, the British pound may drop to 1.1750.

We may speak about an uptrend only after the quotes fix above 1.2050 on the 4-hour chart. In this case, the price may return to the swing high of 1.2150 which is offering resistance.

This image is no longer relevant

What's on the chart

The candlestick chart type is white and black graphic rectangles with lines above and below. With a detailed analysis of each individual candlestick, you can see its characteristics relative to a particular time frame: the opening price, closing price, and intraday high and low.

Horizontal levels are price coordinates, relative to which a price may stop or reverse its trajectory. In the market, these levels are called support and resistance.

Circles and rectangles are highlighted examples where the price reversed in history. This color highlighting indicates horizontal lines that may put pressure on the asset's price in the future.

The up/down arrows are landmarks of the possible price direction in the future.

รับผลกำไรจากการเปลี่ยนแปลงอัตราสกุลเงินดิจิทัลกับ InstaForex.
ดาวน์โหลด MetaTrader 4 และเปิดการซื้อขายครั้งแรกของคุณ.
  • Grand Choice
    Contest by
    InstaForex
    InstaForex always strives to help you
    fulfill your biggest dreams.
    เข้าร่วมการแข่งขัน
  • Chancy Deposit
    ฝากเงินในบัญชีของคุณใน $3,000 และรับ $3000 ไปเพิ่ม!
    ใน กันยายน ทางเราได้ออก$3000 ภายในแคมเปญ Chancy Deposit !
    คว้าโอกาสที่จะชนะด้วยการฝากเงิน $3,000 ไปในบัญชีเทรด เมื่อทำตามเงื่อนไขนี้แล้ว คุณก็จะกลายเป็นผู้เข้าร่วมแคมเปญ
    เข้าร่วมการแข่งขัน
  • เทรดให้ดีแล้วคว้ารางวัล
    เติมเงินในบัญชีของคุณอย่างน้อย $500 สมัครเข้าร่วมการแข่งขัน และลุ้นรับรางวัลอุปกรณ์ติดต่อสื่อสารแบบพกพา
    เข้าร่วมการแข่งขัน
  • โบนัส 100%
    โอกาสพิเศษของคุณในการรับโบนัส 100% จากเงินฝากของคุณ
    รับโบนัส
  • โบนัส 55%
    สมัครรับโบนัส 55% สำหรับการฝากทุกครั้ง
    รับโบนัส
  • โบนัส 30%
    รับโบนัส 30% ทุกครั้งที่คุณเติมเงินในบัญชีของคุณ
    รับโบนัส


บทความแนะนำ

หากไม่สะดวกคุยในตอนนี้
ระบุคำถามไว้ได้ใน แชท.
Widget callback