empty
 
 
01.12.2022 11:17 AM
Technical analysis of EUR/USD for December 2022

trend analysis:

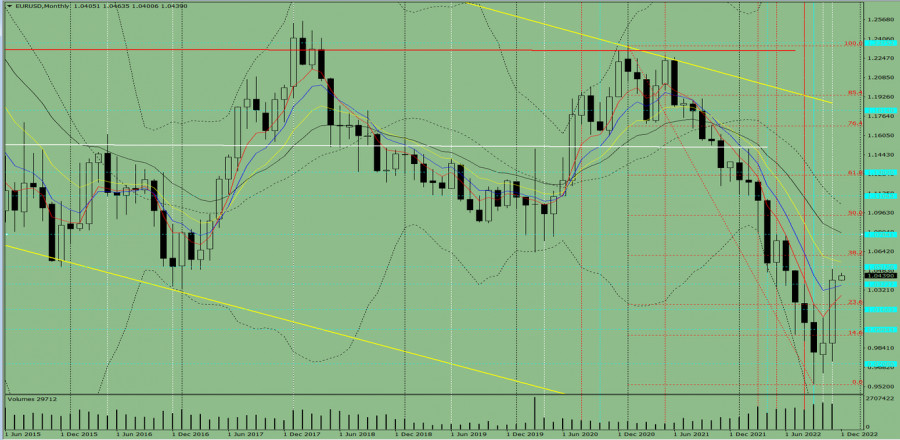
EUR/USD will increase this December, starting from 1.0323 (closing of the November monthly candle) to 1.0609, which is the 38.2% retracement level (red dotted line). Then, it will go to the historical resistance level of 1.0784 (blue dotted line), before turning down again.

This image is no longer relevant

Fig. 1 (monthly chart)

Comprehensive analysis:

Indicator analysis - uptrend

Fibonacci levels - uptrend

Volumes - uptrend

Candlestick analysis - uptrend

Trend analysis - uptrend

Bollinger bands - uptrend

All this points to an upward movement in EUR/USD.

Conclusion: The pair will have a bullish trend, with no first lower shadow on the monthly white candle (the first week of the month is white) and no second upper shadow (the last week is white).

Throughout the month, quotes will climb from 1.0323 (closing of the November monthly candle) to the 38.2% retracement level at 1.0609 (red dotted line), go to the historical resistance level of 1.0784 (blue dotted line), then turn down again.

Alternatively, the pair could rise from 1.0323 (closing of the November monthly candle) to the 38.2% retracement level at 1.0609 (red dotted line), continue to the historical resistance level of 1.0784 (blue dotted line), then jump to the 50.0% retracement level at 1.0941 (blue dotted line). The downward movement may resume after testing this level.

Stefan Doll,
ผู้เชี่ยวชาญด้านการวิเคราะห์ของ InstaForex
© 2007-2023
EURUSD
Euro vs US Dollar
Select timeframe
5
min
15
min
30
min
1
hour
4
hours
1
day
1
week
Start trade
Start trade
  • Grand Choice
    Contest by
    InstaForex
    InstaForex always strives to help you
    fulfill your biggest dreams.
    เข้าร่วมการแข่งขัน
  • Chancy Deposit
    ฝากเงินในบัญชีของคุณใน $3,000 และรับ $8000 ไปเพิ่ม!
    ใน มีนาคม ทางเราได้ออก$8000 ภายในแคมเปญ Chancy Deposit !
    คว้าโอกาสที่จะชนะด้วยการฝากเงิน $3,000 ไปในบัญชีเทรด เมื่อทำตามเงื่อนไขนี้แล้ว คุณก็จะกลายเป็นผู้เข้าร่วมแคมเปญ
    เข้าร่วมการแข่งขัน
  • เทรดให้ดีแล้วคว้ารางวัล
    เติมเงินในบัญชีของคุณอย่างน้อย $500 สมัครเข้าร่วมการแข่งขัน และลุ้นรับรางวัลอุปกรณ์ติดต่อสื่อสารแบบพกพา
    เข้าร่วมการแข่งขัน
  • โบนัส 100%
    โอกาสพิเศษของคุณในการรับโบนัส 100% จากเงินฝากของคุณ
    รับโบนัส
  • โบนัส 55%
    สมัครรับโบนัส 55% สำหรับการฝากทุกครั้ง
    รับโบนัส
  • โบนัส 30%
    รับโบนัส 30% ทุกครั้งที่คุณเติมเงินในบัญชีของคุณ
    รับโบนัส

Recommended Stories

March 21, 2023 : EUR/USD daily technical review and trading opportunities.

The market has remained under buying pressure until a plateau level occurred around 1.0800-1.0850. This was followed by a significant SELLING price action leading to the recent price decline

Mohamed Samy 17:15 2023-03-21 UTC+2

March 21, 2023 : EUR/USD Intraday technical analysis and trading plan.

Price action around the key-level of (1.0550-1.0600) was quite bullish. That's why, further bullish continuation towards 1.0800 was demonstrated. Moreover, more bullish advancement towards the nearest supply zone around 1.1150-1.1200

Mohamed Samy 17:14 2023-03-21 UTC+2

March 21, 2023 : GBP/USD Intraday technical analysis and significant key-levels.

Please take into consideration that bullish breakout above 1.2340 will probably enable further advancement towards 1.2700. However, the GBPUSD bulls failed to record a new high above 1.2200. Instead

Mohamed Samy 17:14 2023-03-21 UTC+2

Technical analysis on EURUSD for March 21st, 2023.

EURUSD is trading around 1.0775. Short-term trend is bullish as price continues making higher highs and higher lows inside the blue upward sloping channel. Price is now approaching the resistance

Alexandros Yfantis 16:05 2023-03-21 UTC+2

Technical analysis on USDJPY for March 21st, 2023.

In our USDJPY analysis yesterday we noted that there were increased chances of a bounce. Price made a low at 130.56 and is now challenging the upper channel boundary. Price

Alexandros Yfantis 15:52 2023-03-21 UTC+2

Technical analysis on NZDUSD for March 21st, 2023.

In our previous analysis we mentioned the rejection at the neckline resistance at 0.6265. We noted that in order to get a bullish signal price needed to push above

Alexandros Yfantis 15:47 2023-03-21 UTC+2

Trading Signal for USD/JPY for March 21 - 22, 2023: buy if rebounds from 131.75 (21 SMA - 4/8 Murray )

According to the 4-hour chart, we can see that the yen broke the descending wedge pattern around 131.56. USD/JPY is expected to have a pullback towards this zone

Dimitrios Zappas 15:46 2023-03-21 UTC+2

Trading Signal for GOLD (XAU/USD) for March 21 - 22, 2023: sell below $1,968 or buy if rebound $1,960 (7/8 Murray - 21 SMA )

Our trading plan for the next few hours is to sell below 7/8 Murray located at 1,968, with targets at 1,960. Around this level, we can expect a technical bounce

Dimitrios Zappas 14:41 2023-03-21 UTC+2

Video market update for March 21, 2023

Upside momentum

Petar Jacimovic 12:42 2023-03-21 UTC+2

Forex forecast 03/21/2023 AUD/USD, USD/CAD, SP500 and Bitcoin from Sebastian Seliga

Let's take a look at the technical picture of AUD/USD, USD/CAD, SP500 and Bitcoin

Sebastian Seliga 12:03 2023-03-21 UTC+2
หากไม่สะดวกคุยในตอนนี้
ระบุคำถามไว้ได้ใน แชท.