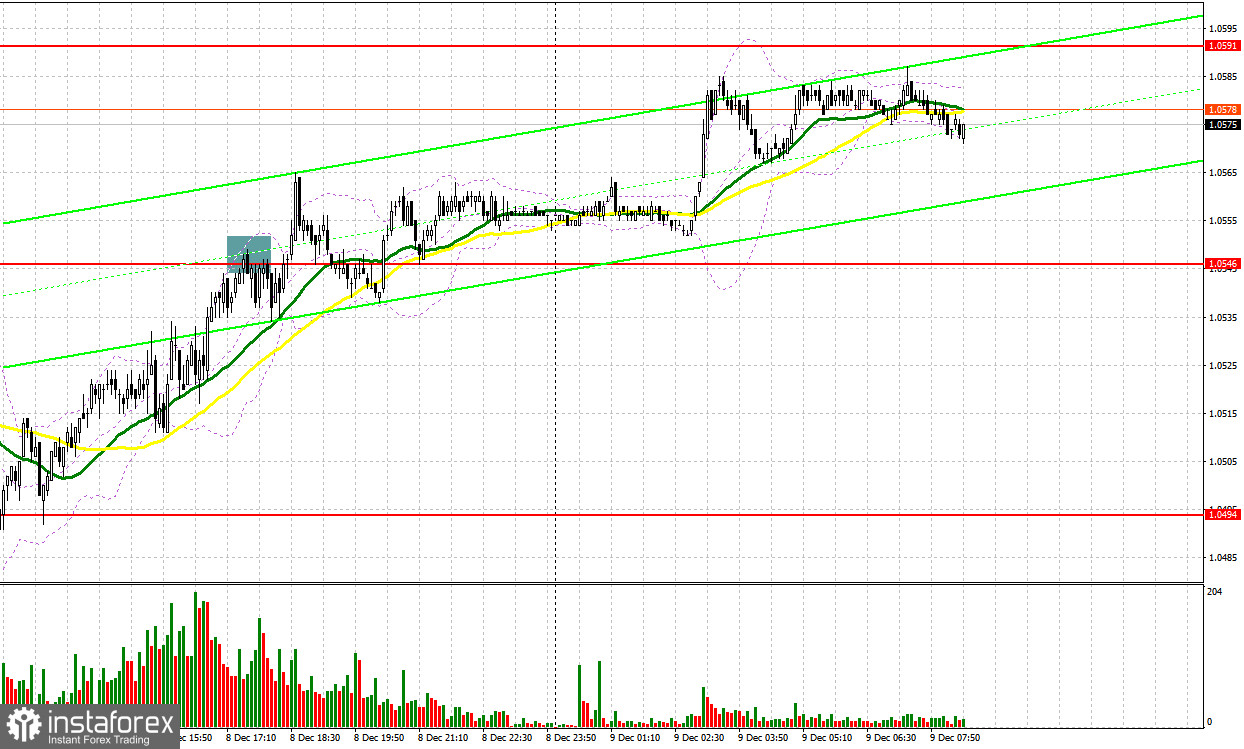
Yesterday, there were several entry points. Now, let's take a look at the 5-minute chart and try to figure out what actually happened. In the morning article, I turned your attention to the level of 1.0525 and recommended making decisions on market entry with this level in focus. The price growth and a false breakout at 1.0525 generated a sell signal. The euro dropped by more than 35 pips. However, it failed to approach the support level of 1. 0486. In the afternoon, the pair performed a similar false breakout around 1.0546. The downward movement was only 10 pips. After that, the euro resumed an upward movement.
When to open long positions on EUR/USD:
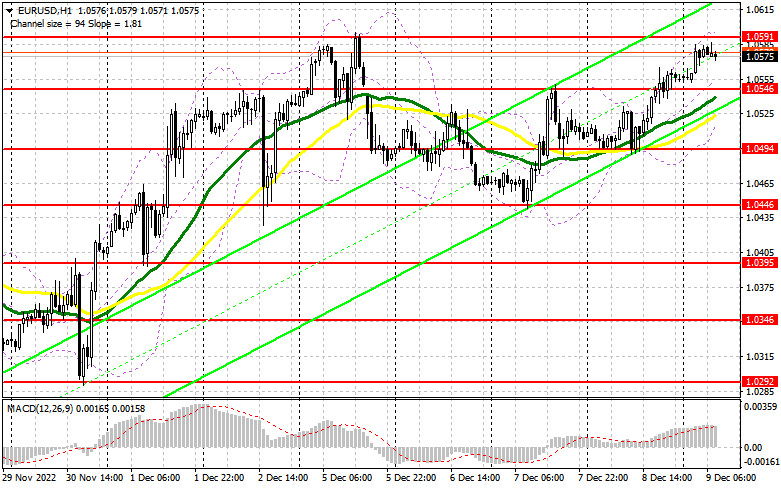
In the morning, there are no drivers that could somewhat impact the trajectory of the euro. Yesterday, it climbed higher amid expectations of more rate hikes by the ECB albeit at a slower pace. However, this might not be enough to push the euro to December highs. The speech of ECB policymaker Andrea Enria is unlikely to help the instrument break above 1.0591. Therefore, the more preferable strategy for today is to buy on the decline. A false breakout of the support level of 1.0546 will give a buy signal. It could enable the euro to reach a monthly high of 1.0591. Below the 1.0546 level, the moving averages are passing. A breakout and a downward retest of this level will provide a buying opportunity. The euro could rise to 1.0640, cementing the bullish trend. A breakout of this level will also force bears to close Stop Loss orders, creating conditions for increasing long positions. If so, the pair is likely to grow above 1.0663 where I recommend locking in profits. If EUR/USD declines and buyers show no activity at 1.0546, the pressure on the pair will return. However, it will not undermine the bullish bias. The euro may just slide into the sideways channel. A breakout of 1.0546 will push EUR/USD to the next support level of 1.0494. I would also advise you to open long positions there only after a false breakout takes place. You could buy EUR/USD immediately at a bounce from 1.0446 or lower at 1.0395, keeping in mind an upward intraday correction of 30-35 pips.
When to open short positions on EUR/USD:
Sellers are now sitting on the sidelines, awaiting when the pair approaches a monthly high. They will be alert to the movements of the euro at this high. If there is no sharp rise, which would force the bears to close Stop Loss orders, bears could push the pair below 1.0591. A false breakout will give an excellent sell signal in the morning. If so, it may lead to a downward movement to 1.0546. Bulls and bears will tussle for this level as it will become the middle of the sideways channel. If bulls are unable to defend it, they could lose the upper hand. The breakout and an upward retest of this level will create a new entry point into short positions with the prospect of a correction to 1.0494. A drop below this level will trigger a deeper decline to 1.0446, fueling hopes for the resumption of a bear market. I recommend locking in profits there. A more distant target will be the 1.0395 level. If EUR/USD rises during the European session and bears show no energy at 1.0591, which is most likely, the pair is likely to touch 1.0640. It is recommended to open short positions there only if the pair fails to consolidate at this level. You could sell EUR/USD at a bounce from a high of 1.0663, keeping in mind a downward intraday correction of 30-35 pips.
COT report
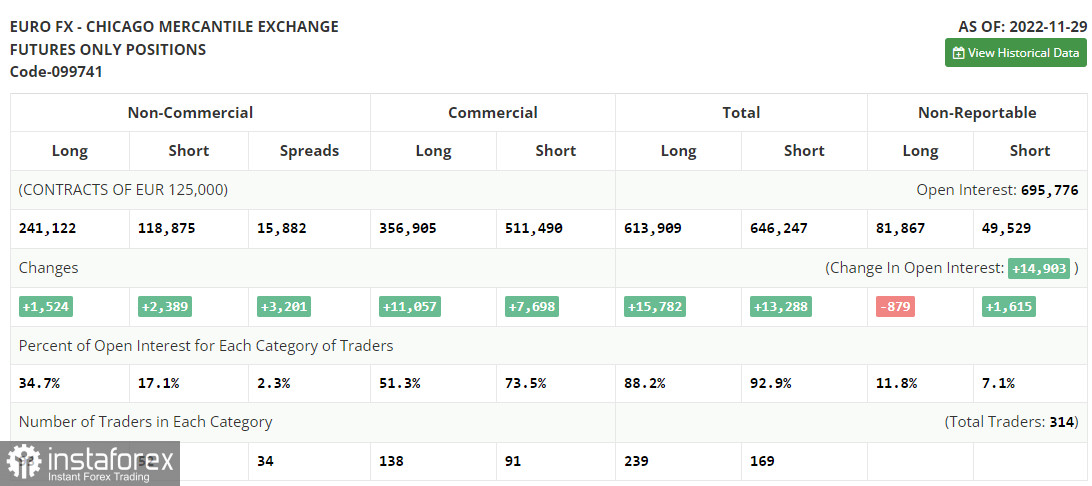
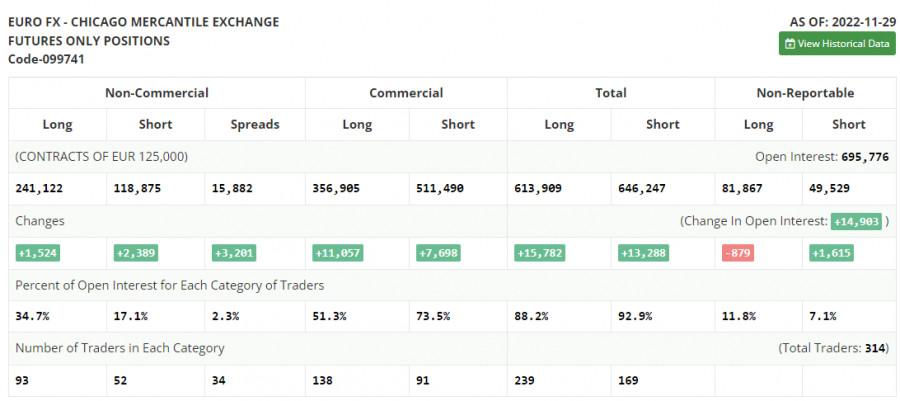
According to the COT report from November 29, the number of both long and short positions increased. Announcements made by Jerome Powell last week retained demand for risk assets, including the euro. Since the pair has been confidently rising since November, there are a lot of traders who prefer selling at the current levels. Recent fundamental data from the US, namely, business activity and labor market indicators, allowed traders to bet on a longer period of higher interest rates in the US in the upcoming year. Against the backdrop, there is no good reason to open long positions in the midterm. The higher the euro climbs, the deeper it will fall. The week is expected to be calm and traders are likely to shift their attention to the FOMC meeting, which is scheduled for December 13-14. According to the COT report, the number of long non-commercial positions increased by 1,524 to 241,122, whereas the number of short non-commercial positions jumped by 2,389 to 118,875. At the end of the week, the total non-commercial net position decreased slightly to 122,234 from 123,112. This indicates that investors are no longer in such a hurry to buy back the euro since it is not as cheap as it was a few months earlier. The weekly closing price advanced to 1.0342 from 1.0315.
Signals of technical indicators
Moving averages
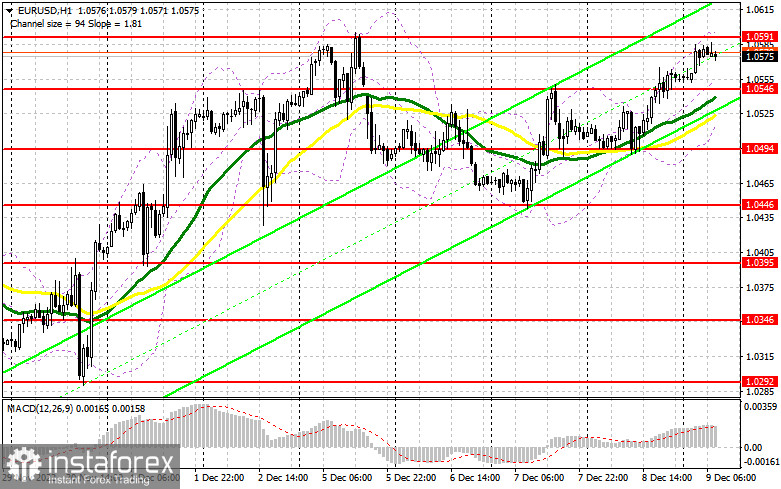
EUR/USD is trading above 30- and 50-period moving averages, which indicates a further rise.
Remark. The author is analyzing the period and prices of moving averages on the 1-hour chart. So, it differs from the common definition of classic daily moving averages on the daily chart.
Bollinger Bands
If EUR/USD climbs, the indicator's upper border at 1.0591 will serve as resistance. If EUR/USD falls, the indicator's lower border at 1.0520 will act as support.
Definitions of technical indicators
- Moving average (moving average, determines the current trend by smoothing out volatility and noise). Period 50. It is marked yellow on the chart.
- Moving average (moving average, determines the current trend by smoothing out volatility and noise). Period 30. It is marked green on the chart.
- MACD indicator (Moving Average Convergence/Divergence - convergence/divergence of moving averages) Quick EMA period 12. Slow EMA period to 26. SMA period 9
- Bollinger Bands (Bollinger Bands). Period 20
- Non-commercial speculative traders, such as individual traders, hedge funds, and large institutions that use the futures market for speculative purposes and meet certain requirements.
- Long non-commercial positions represent the total long open position of non-commercial traders.
- Short non-commercial positions represent the total short open position of non-commercial traders.
- Total non-commercial net position is the difference between the short and long positions of non-commercial traders.