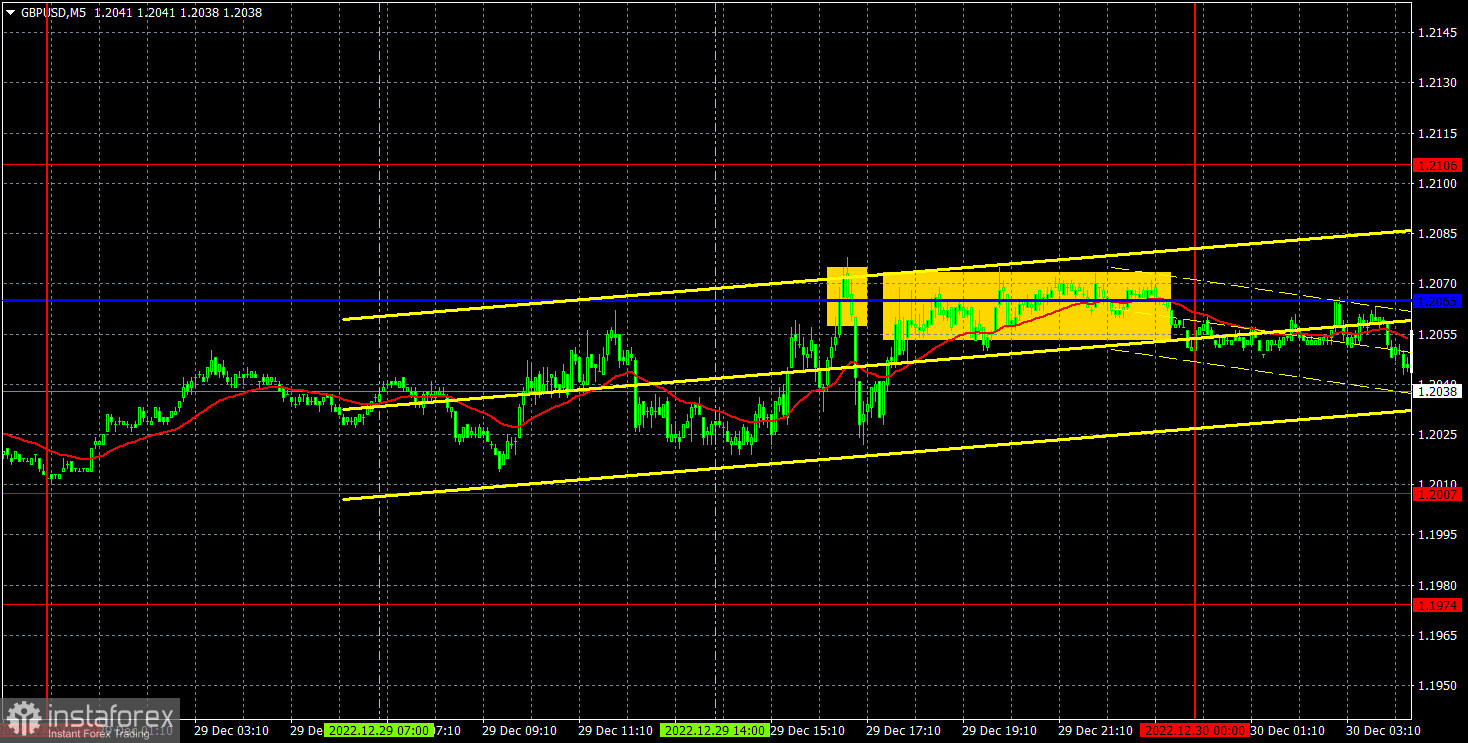
M5 chart of EUR/USD
EUR/USD tried to leave the 1.0581-1.0669 horizontal channel ahead of the New Year. We can hardly say that it succeeded, but it was a few dozen points above that channel. But we can't say that the flat is over now either. Yes, there is a slight upward bias, and it might last for the near future, but volatility is still low, and the day's growth by 20-30 points can hardly be called a trend. Basically, I don't expect the market to be active right now, and I don't expect any trend movements from the pair either. Taking into consideration that today is the last trading day of 2022, it is better to wait for the new year and the flat to end. I still expect a downward movement from the euro, but even in the last days of the year we see the desire to rise while the pound is falling. There is almost no logic in the movements now.
Trading signals were formed three times yesterday. At the beginning, the pair rebounded from 1.0658 and managed to go down "as much as" 15 pips, so a Stop Loss should have been set at breakeven on the short position. That was followed by another sell signal around the area of 1.0581-1.0669, which could only bring losses, because the pair did not even fall 15 pips. Nevertheless, closer to the evening, the position could be closed manually at a minimum loss.
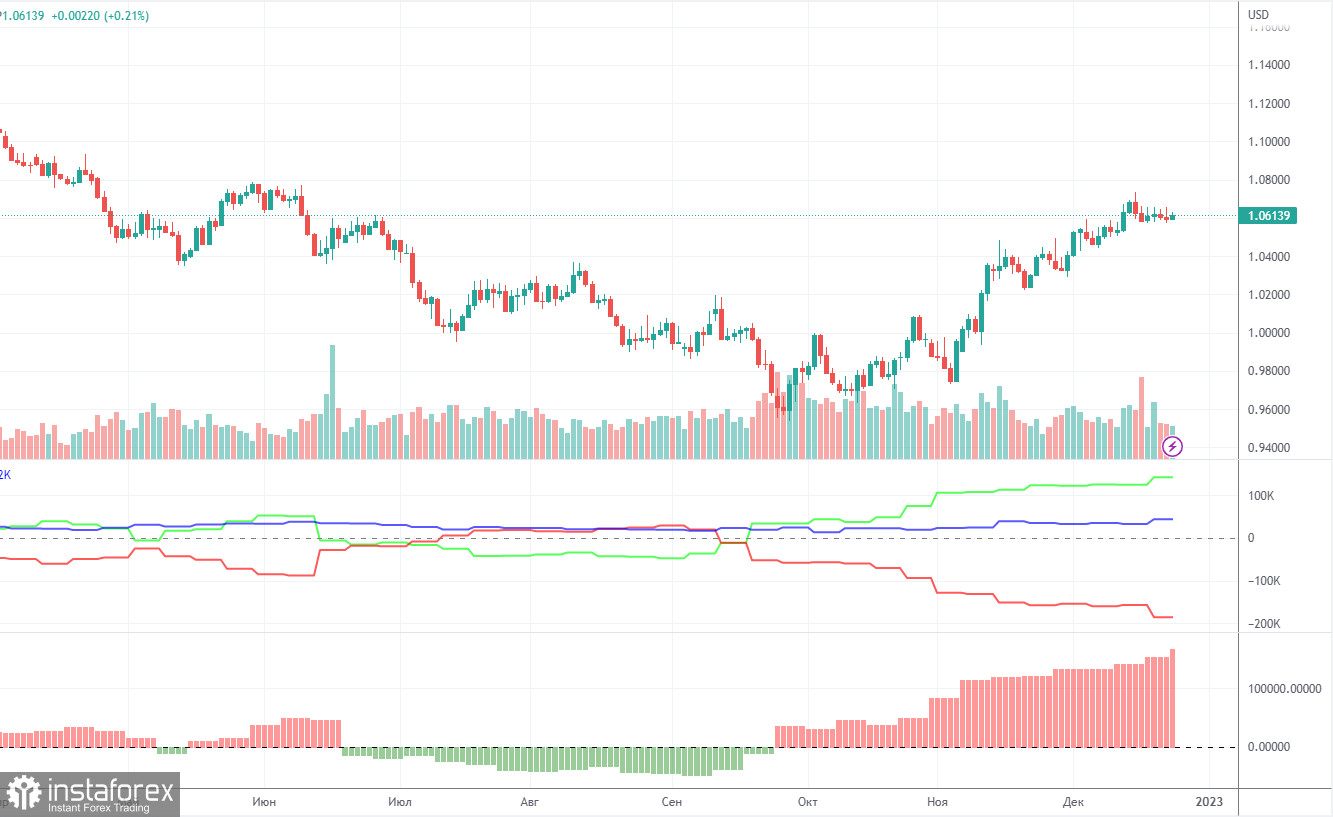
COT report
The COT reports for the euro in the last few months have been fully consistent with what is happening in the market. You can clearly see on the chart that the net position of big players (the second indicator) has been growing since early September. Around the same time, the euro started to grow. At this time, the net position of the non-commercial traders has been bullish and strengthens almost every week, but it is a rather high value that allows us to assume that the upward movement will end soon. Notably, the green and red lines of the first indicator have moved far apart from each other, which often means the end of the trend. During the given period, non-commercial traders opened 12,700 long positions, whereas the number of short positions fell by 4,800. Thus, the net positions rose by 7,900. The number of long positions is 143,000 higher than the number of short positions opened by non-commercial traders. So the question now is how long will the big players increase their longs? From our point of view, this process can not continue for another 2 or 3 months. Even the net position indicator shows that we need to "unload" a bit, that is, to adjust. The overall number of short orders exceeds the number of long orders by 43,000 (684,000 vs. 641,000).
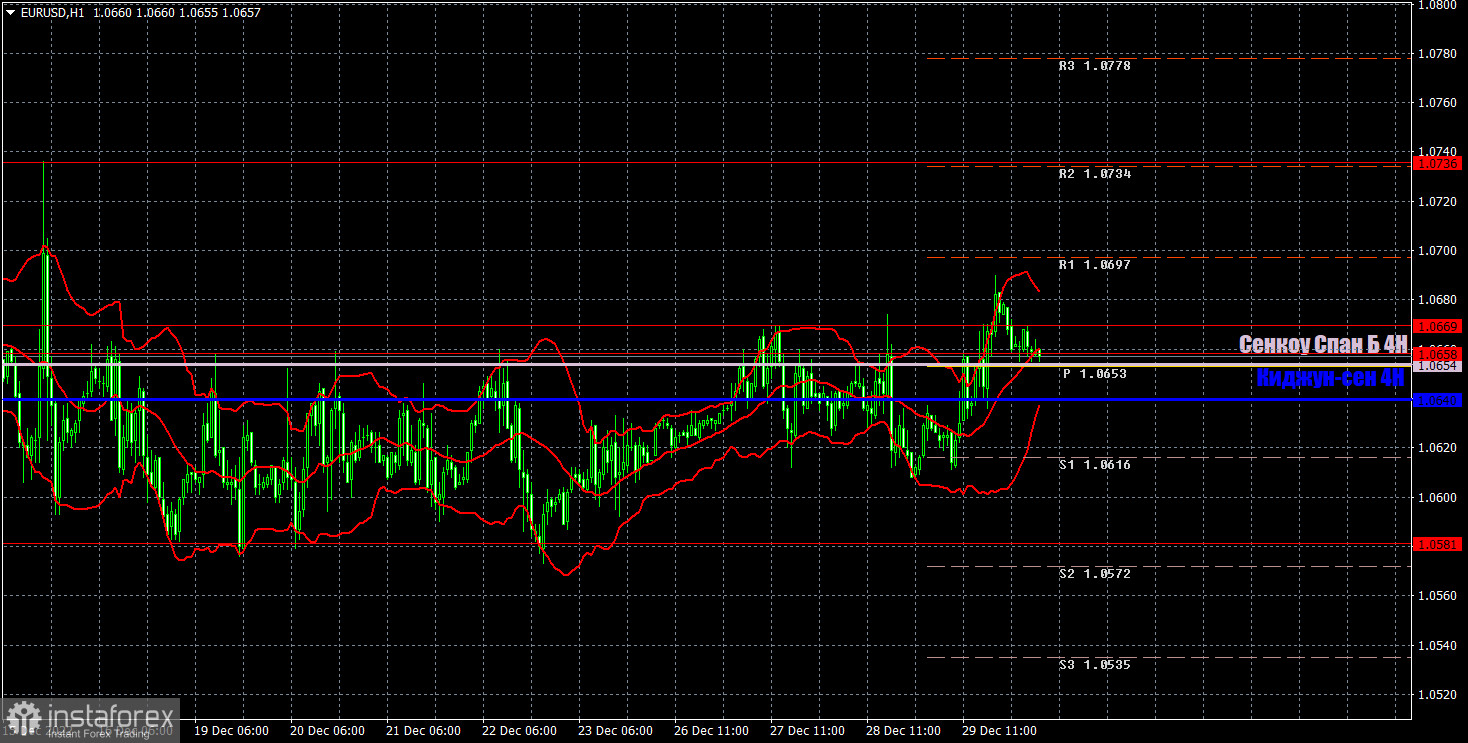
H1 chart of EUR/USD
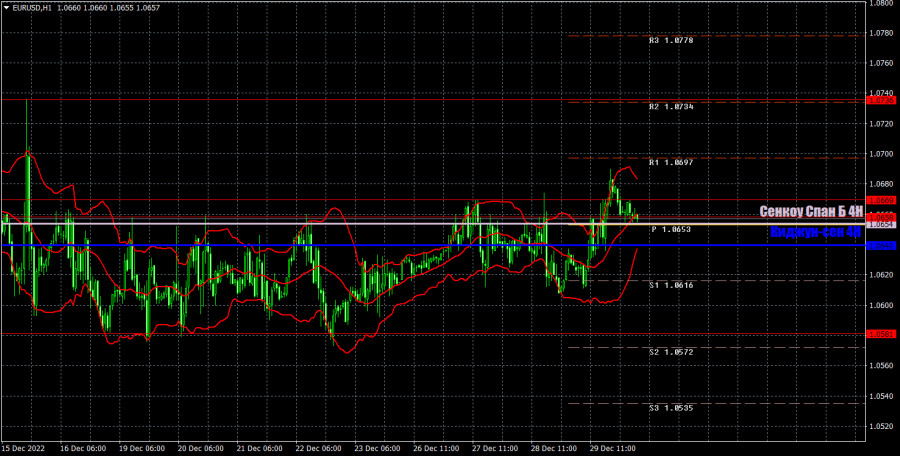
EUR/USD is still in a high position on the one-hour chart, and is still in a total flat. Lines of the Ichimoku indicator have already merged with each other and have lost meaning. As you can see, they are being worked out accurately enough. EUR is rigging again, so we have moved the lines to their real price levels, but the price can easily and freely cross them several times a day. On Friday, the pair may trade at the following levels: 1.0340-1.0366, 1.0485, 1.0581, 1.0658-1.0669, 1.0736, 1.0806, as well as Senkou Span B (1.0654) and Kijun Sen (1.0640). Lines of the Ichimoku indicator may move during the day, which should be taken into account when determining trading signals. There are also support and resistance levels, but signals are not formed near these levels. Bounces and breakouts of the extreme levels and lines could act as signals. Don't forget about stop-loss orders, if the price covers 15 pips in the right direction. This will prevent you from losses in case of a false signal. There are still no important events scheduled for December 30 in the EU and the US. I don't expect the flat to end today. Volatility will probably remain low.
What we see on the trading charts:
Price levels of support and resistance are thick red lines, near which the movement may end. They do not provide trading signals.
The Kijun-sen and Senkou Span B lines are the lines of the Ichimoku indicator, moved to the one-hour chart from the 4-hour one. They are strong lines.
Extreme levels are thin red lines from which the price bounced earlier. They provide trading signals.
Yellow lines are trend lines, trend channels, and any other technical patterns.
Indicator 1 on the COT charts reflects the net position size of each category of traders.
Indicator 2 on the COT charts reflects the net position size for the non-commercial group.