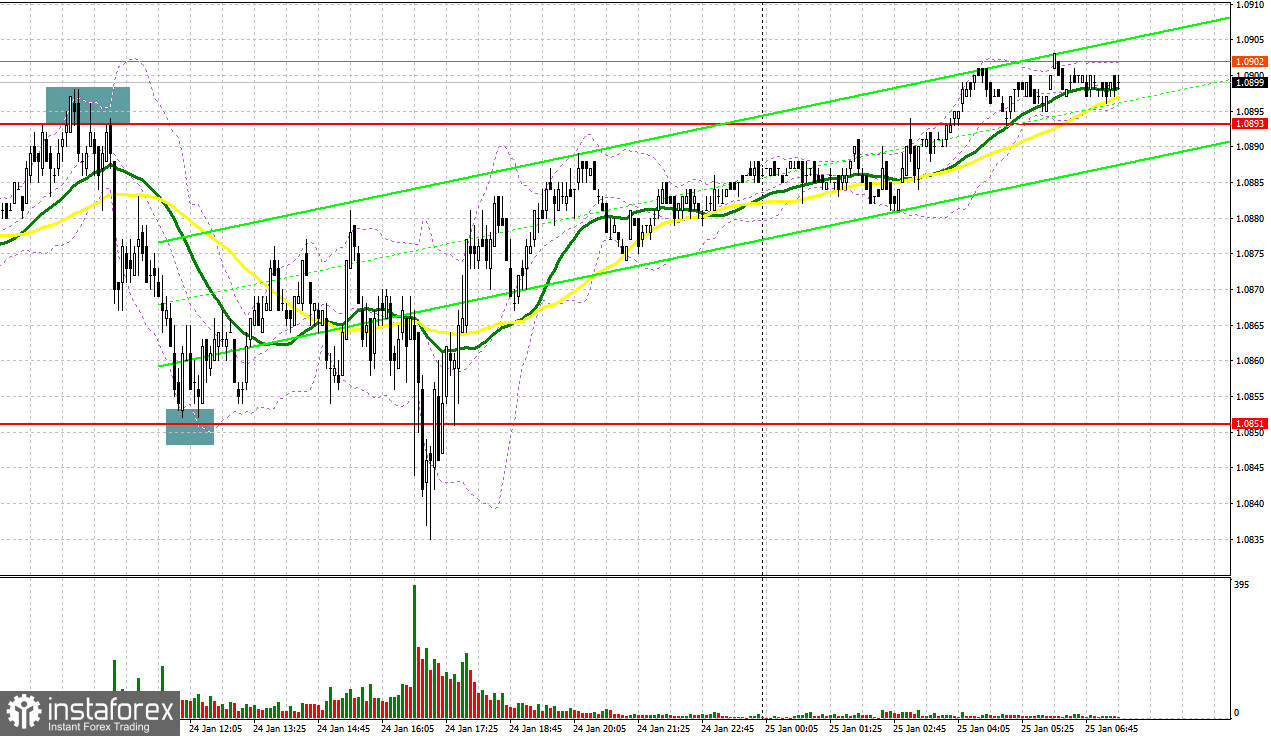
There were several entry signals yesterday. Let us have a look at the 5-minute chart and figure out what happened. In my morning forecast, I highlighted the level of 1.0893 and recommended to make market entry decisions with this level in mind. Before the release of eurozone PMI data, the euro tested that level and performed a false breakout. Euro bulls ignored the positive statistic data, creating a sell signal and sending the pair down by 40 pips. In the second half of the fay, bulls managed to keep the pair above 1.0851, and the false breakout below that level created a buy signal. EUR/USD went up by about 30 pips and came under renewed pressure afterward.
When to open long positions on EUR/USD:
It is obvious that euro bulls do not want to lose the initiative, and they push back against bears at every possible opportunity, like it happened yesterday after the US PMI data release. There are no important data releases today, and the only notable data on the calendar are IFO's business climate index, current assessment index and the economic expectations index for Germany. If these indexes show an increase, it can help the euro to reach monthly highs, and a sharp decline will put pressure on the pair. I will wait for the pair to move down to the area of 1.0865 and open long positions there only after a false breakout. The target is the area of 1.0922, which the pair failed to reach yesterday. A breakout above this range is unlikely because it requires strong fundamental or geopolitical factors. If it does happen, a downward retest of 1.0922 will create an additional entry point for long positions and push the pair to 1.0970. If EUR/USD breaks through this level as well, it will trigger the stop-loss orders of bears and create an additional buy signal. From there, the pair may rise to 1.1006, where I will take profit. If EUR/USD declines and bulls are inactive at 1.0865 in the first half of the day, a larger correction could begin. A drop below this well will put an end to bulls' expectations of a new uptrend. The key level in this case will be the next support level at 1.0806, the lower boundary of the emerging horizontal channel. Only a false breakout of this level will create a buy signal. Long positions can be opened immediately if EUR/USD bounces off the low of 1.0769 or the 1.0728 area, targeting an upward intraday correction of 30-35 pips.
When to open short positions on EUR/USD:
Bears have lost 1.0865 yesterday amid the release of weak PMI data in the US, which complicates their current situation. To keep the pair within a horizontal channel until next week's meetings of central banks, they need to regain 1.0865 and keep the pair from surpassing the resistance level of 1.0922. If EUR/USD surges higher during the European session after strong IFO data, the best opportunity for opening short positions will be an unsuccessful consolidation above this area, which would push the pair towards the key level of 1.0865. Below this level, increased pressure will force traders to close some long positions, making it important for bulls and bears. The moving averages near 1.0865 do not present any difficulties to either side. A breakout and an upward retest of 1.0865 will create an additional sell signal, pushing EUR/USD towards 1.0806. If it breaks through this level as well, it may then drop to 1.0768. The most distant target, which would signal that the bear market has begun, is 1.0728. I will take profits there. If EUR/USD moves up during the European session and bears are idle at 1.0922, which is quite plausible, traders should wait until the pair drops to 1.0970 and fails to consolidate there before opening short positions. Short positions can also be opened immediately if the pair bounces off 1.1006 targeting a downward correction of 30-35 pips.
Commitment of Traders (COT) report:
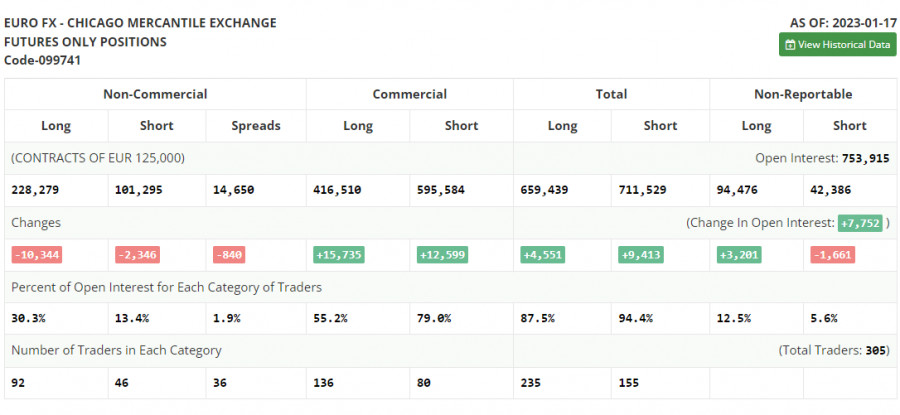
The Commitment of Traders (COT) report for January 17 showed that both long and short positions declined. Obviously, traders are starting to take a wait-and-see attitude again after euro's strong growth in the run-up to the Fed meeting next week. Rather weak US fundamental data, particularly lower retail sales in December last year, suggest that the situation is getting worse and further aggressive Fed policy may hurt the economy even more. On the other hand, inflation continues to decelerate, allowing the regulator to reconsider the pace and the target range of interest rates. At the same time, the euro is getting support from statements by European Central Bank officials about the need for further aggressive rate hikes to beat inflation, thus helping EUR/USD to renew its monthly highs. The COT report showed that long non-commercial positions declined by 10,344 to 228,279, while short non-commercial positions fell by 2,346 to 101,295. At the end of the week, total non-commercial net positions decreased to 126,984 versus 134,982 a week prior. All this suggests that investors though believe that the euro will continue to rise, but are waiting for more clarity from central banks on future interest rates. The weekly closing price rose to 1.0833 from 1.0787.
Indicators' signals
Moving averages
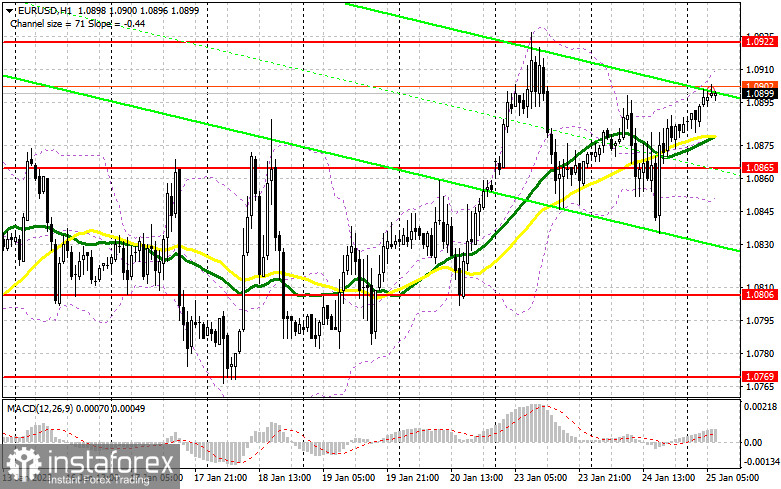
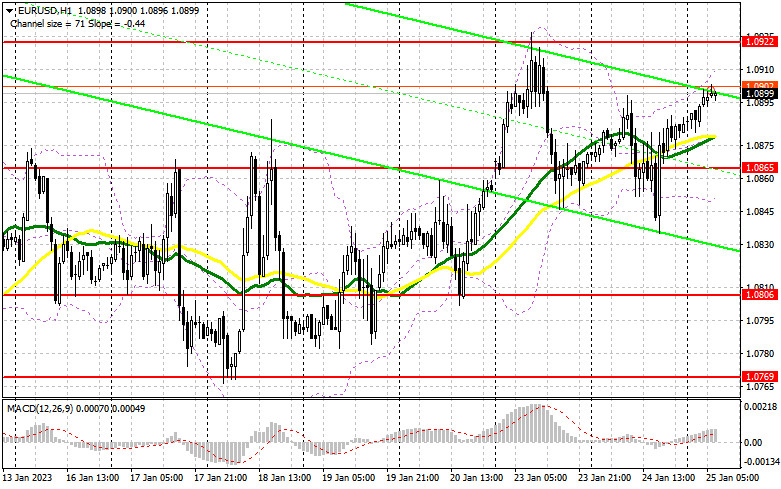
Trading is carried just above the 30-day and 50-day moving averages, indicating that bulls are trying to extend the pair's upside momentum.
Note: The period and prices of moving averages are considered by the author on the H1 (1-hour) chart and differ from the general definition of the classic daily moving averages on the daily D1 chart.
Bollinger Bands
If the pair rises, it will encounter resistance at the upper boundary of the indicator near 1.0920. If EUR/USD declines, the lower boundary of the indicator at 1.0860 will provide support.
Description of indicators
Moving average (moving average, determines the current trend by smoothing out volatility and noise). Period 50. It is marked yellow on the chart. Moving average (moving average, determines the current trend by smoothing out volatility and noise). Period 30. It is marked green on the chart. MACD indicator (Moving Average Convergence/Divergence - convergence/divergence of moving averages) Quick EMA period 12. Slow EMA period to 26. SMA period 9 Bollinger Bands (Bollinger Bands). Period 20 Non-commercial speculative traders, such as individual traders, hedge funds, and large institutions that use the futures market for speculative purposes and meet certain requirements. Long non-commercial positions represent the total long open position of non-commercial traders. Short non-commercial positions represent the total short open position of non-commercial traders. Total non-commercial net position is the difference between the short and long positions of non-commercial traders.