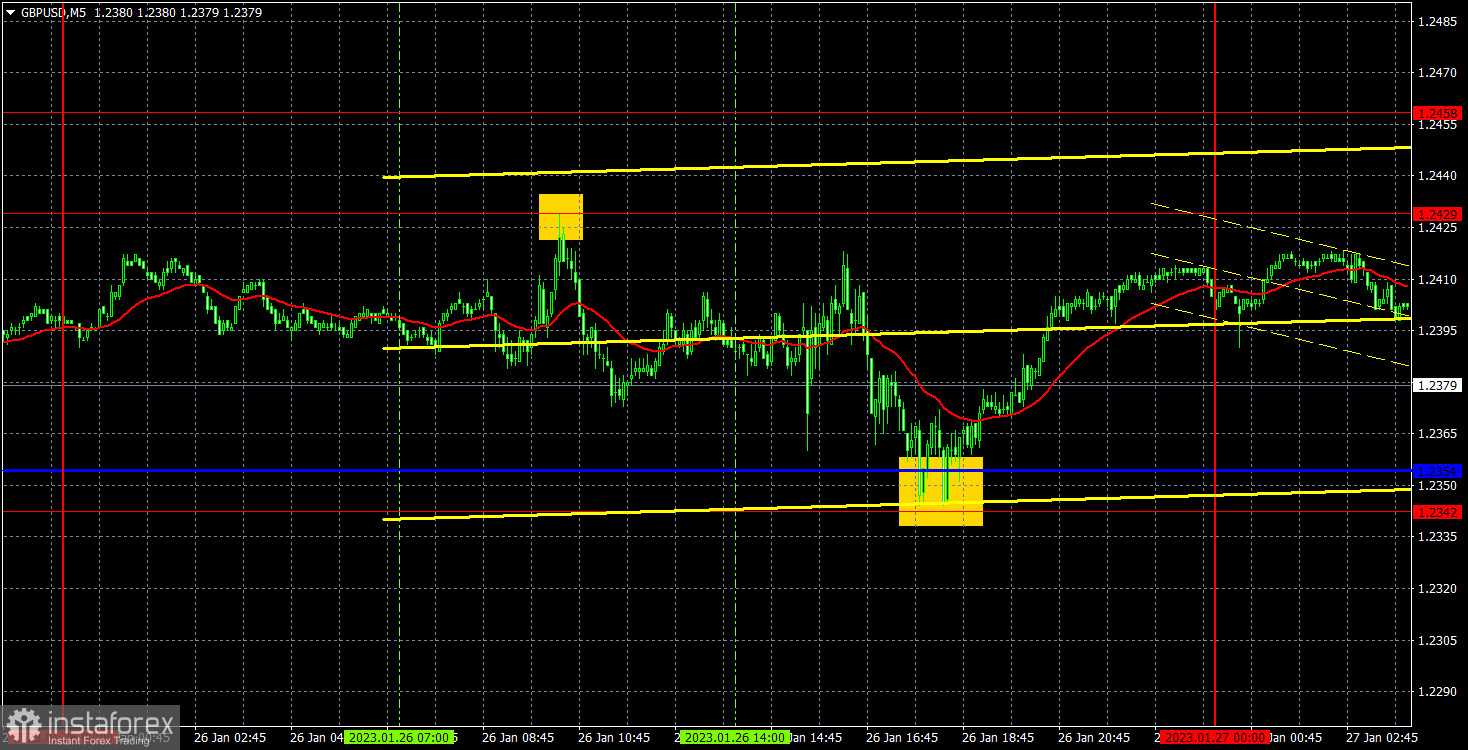
M5 chart of GBP/USD
GBP/USD moved mostly sideways than up or down on Thursday. If you look at the pair's movements over the past two weeks, it seems more like a flat, and a fairly wide one at that. The horizontal channel's limits could be 1.2288 and 1.2429. But whether it's wide or narrow doesn't change the matter. The pound keeps moving sideways as well, keeping the uptrend and staying near its local highs. Yesterday, traders had good reasons to buy the dollar. But the fall was only local, intraday in nature. If there were no US reports, the movements could be the same. Therefore, you should keep in mind that the market interprets the macro data either in favor of the pound, or they don't pay attention to reports at all. It looks like everything will be decided next week since the Bank of England and Federal Reserve are set to hold meetings then.
Speaking of trading signals, they turned out to be very good. At first, the pair reached the level of 1.2429, rebounded from it, and traders could open a short position using this signal. Then the price fell to 1.2342-1.2354, from which it also bounced. Traders could gain about 50 pips on the first trade, and they could open a longs on the second signal, which also turned out to be profitable. Its profit level depended on where the traders closed it manually.
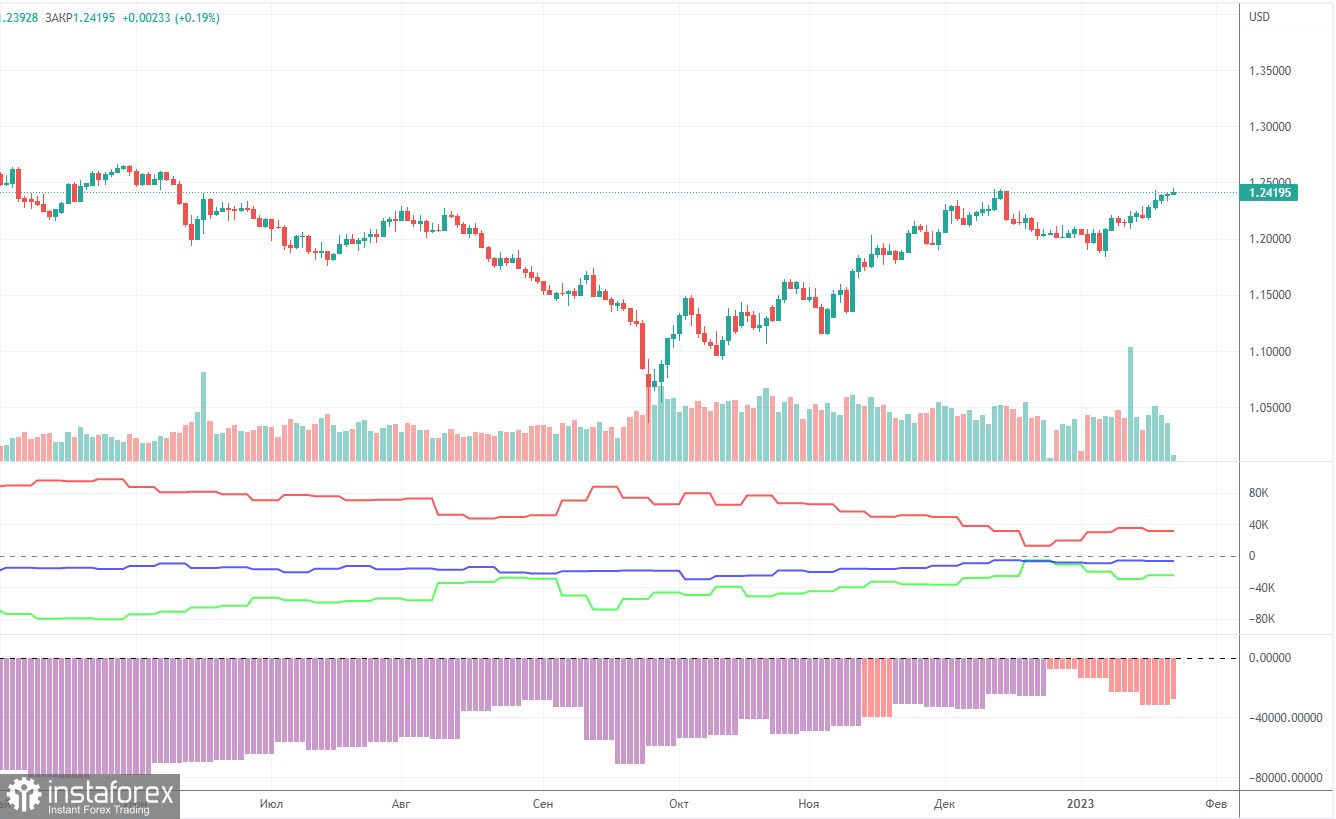
COT report
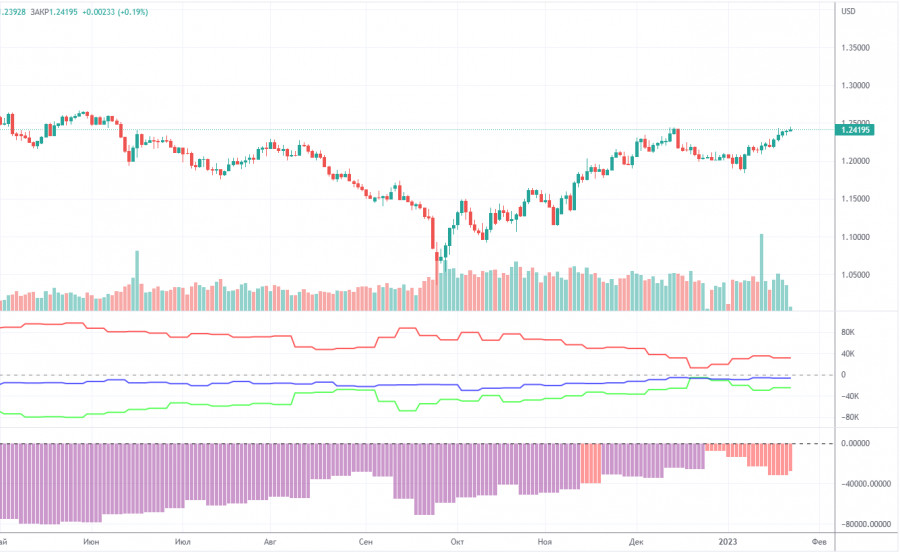
The latest COT report showed a decrease in bearish sentiment. During the given period, non-commercial traders opened 5,500 long positions and as many as 700 short positions. Thus, the net position increased by 4,800. This figure has been on the rise for several months, and the sentiment may become bullish in the near future, but it hasn't yet. Although the pound has grown against the dollar for the last few months, from a fundamental perspective, it is difficult to answer why it keeps rising. On the other hand, it could fall in the near future (in the mid-term prospect) because it still needs a correction. In general, in recent months the COT reports correspond to the pound's movements so there shouldn't be any questions. Since the net position is not even bullish yet, traders may continue to buy the pair over the next few months. Non-commercial traders now hold 41,500 long positions and 66,000 short ones. I remain skeptical about the pound's long term growth, though there are technical reasons for it. At the same time, fundamental and geopolitical factors signal that the currency is unlikely to strengthen significantly.
H1 chart of GBP/USD
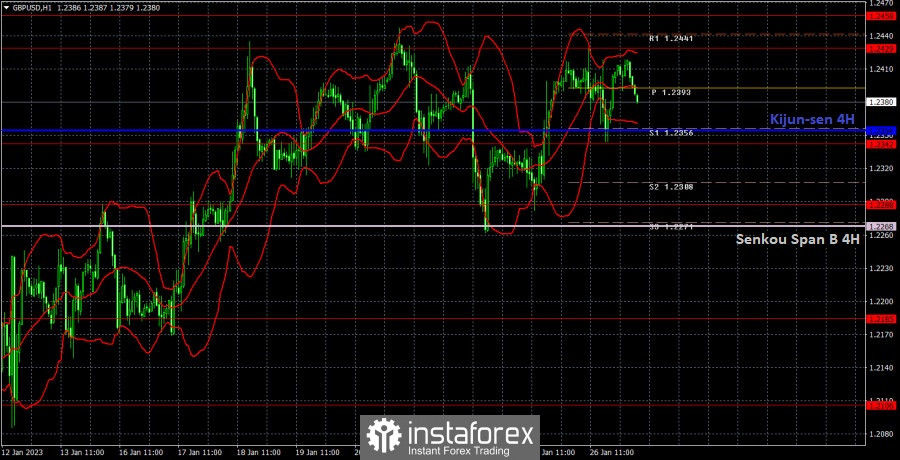
On the one-hour chart, GBP/USD tried to break the uptrend but failed. So, now we have to wait for the pair to settle below the Kijun-Sen line, afterwards we need to overcome the Senkou Span B. Without that there is no reason to expect a strong decline. It still has no specific reasons for growth, but the market stays bullish on the threshold of the Fed and BoE meetings. In parallel, the market is moving in the horizontal channel. On January 27, the pair may trade at the following levels: 1.2106, 1.2185, 1.2288, 1.2342, 1.2429-1.2458, 1.2589, 1.2659. The Senkou Span B (1.2268) and Kijun Sen (1.2354) lines may also generate signals. Pullbacks and breakouts through these lines may produce signals as well. A Stop Loss order should be set at the breakeven point after the price passes 20 pips in the right direction. Ichimoku indicator lines may move during the day, which should be taken into account when determining trading signals. In addition, the chart does illustrate support and resistance levels, which could be used to lock in profits. There are no important developments scheduled for Friday in the UK, but the US will release several minor reports, including Consumer Sentiment Index from University of Michigan as well as Personal Income and Personal Expenditures. I don't expect traders and investors to react to such data so the pair will probably remain flat.
What we see on the trading charts:
Price levels of support and resistance are thick red lines, near which the movement may end. They do not provide trading signals.
The Kijun-sen and Senkou Span B lines are the lines of the Ichimoku indicator, moved to the one-hour chart from the 4-hour one. They are strong lines.
Extreme levels are thin red lines from which the price bounced earlier. They provide trading signals.
Yellow lines are trend lines, trend channels, and any other technical patterns.
Indicator 1 on the COT charts reflects the net position size of each category of traders.
Indicator 2 on the COT charts reflects the net position size for the non-commercial group.