empty
 
 
17.03.2023 12:19 PM
Technical analysis of EUR/USD and GBP/USD on March 17, 2023

EUR/USD

This image is no longer relevant

Larger timeframes

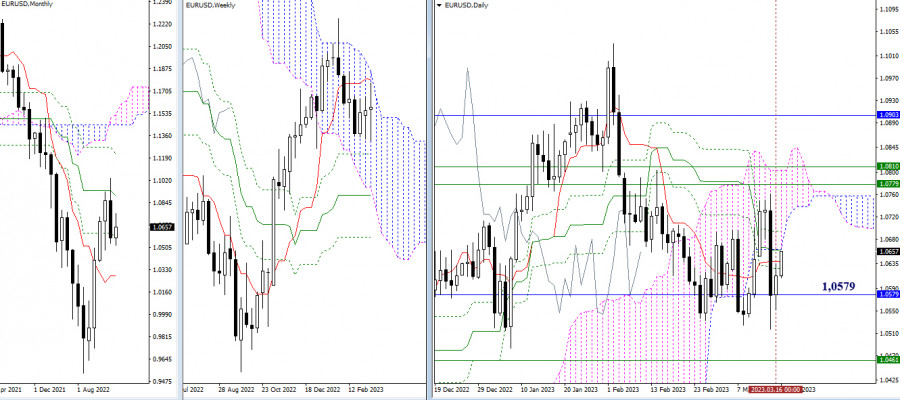
EUR/USD halted its move at a one-month support of 1.0579 and it is getting ready to rebound. The euro bears couldn't push the price through support. Hence, the bulls are entering the market and testing the nearest resistance levels which were passed yesterday with no sweat. Now the levels of the daily Ichimoku cross and the lower border of the daily cloud such as 1.0639 – 1.0661 – 1.0694 serve as resistance. The bulls will be able to exert their influence by testing higher levels, namely one-week levels of 1.0779 – 1.0810.

This image is no longer relevant

H4 – H1

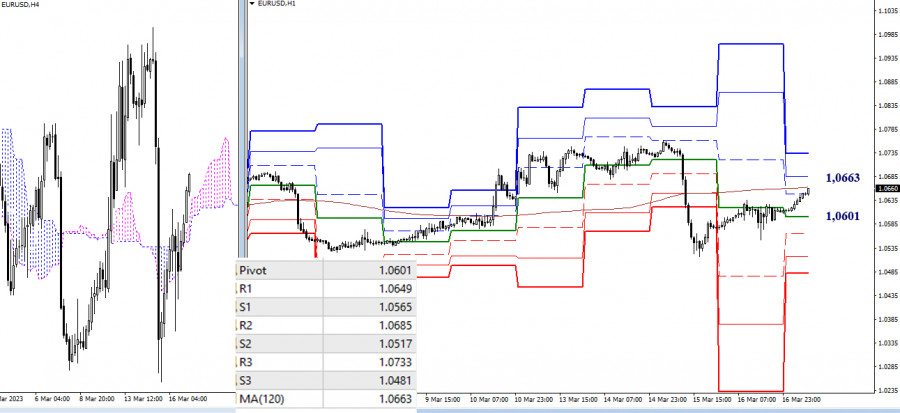
At the moment, EUR/USD is testing the one-week long-term trend line of 1.0663 on smaller timeframes. This level is responsible for shaping a balance on smaller timeframes. If the price settles firmly above it, the bulls will be able to assert their strength. So, we could expect a further climb. The next intraday resistance levels are seen at classic pivot levels of 1.0685 – 1.0733 reinforced by 1.0694. Today the bears are focused on the support levels of 1.0601 (the central pivot intraday level) and 1.0565 – 1.0517 – 1.0481 (classic pivot levels).

***

GBP/USD

This image is no longer relevant

Larger timeframes

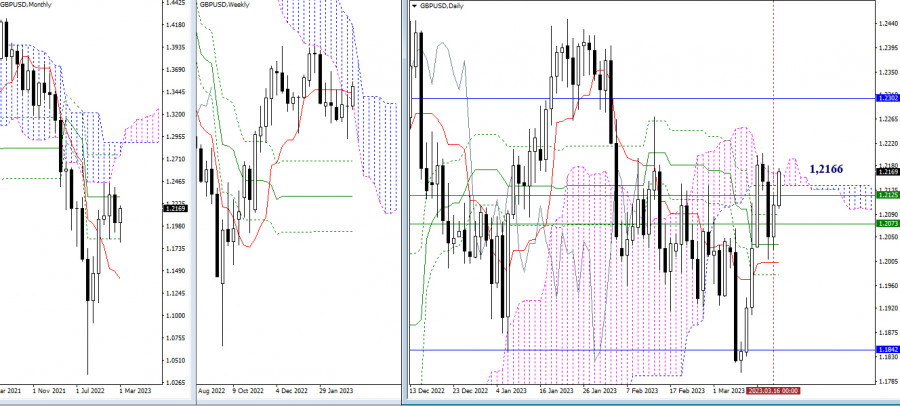
The support levels of GBP/USD coped well with the task and the instrument now aims to exit from the daily cloud at around 1.2166 upward. The next upward targets are seen at 1.2302 (one-month medium-term trend) and 1.2447 (the ultimate high). The key support now comes from one-week levels (1.2125 – 1.2073) and intraday levels (1.2035 – 1.2002).

This image is no longer relevant

H4 – H1

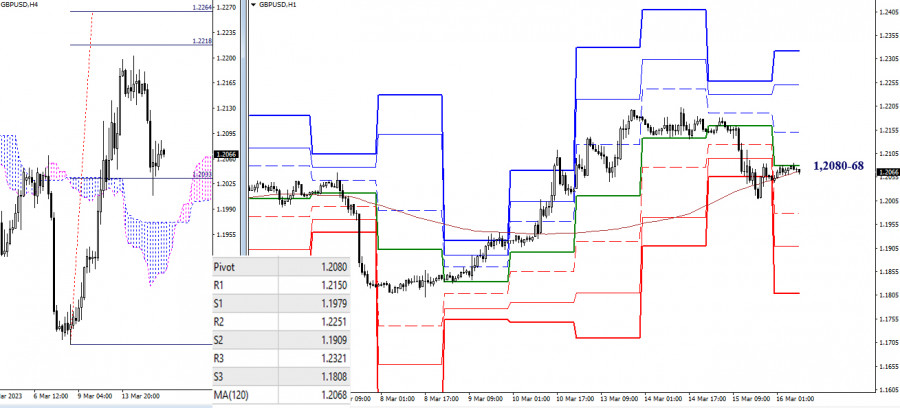
Despite some decline and closing lower, the one-week long-term trend line managed the task well. The bulls are holding the upper hand. On smaller timeframes, it is important for the bulls to update the high of 1.2202 and hit the target breaking the H4 cloud between 1.2218 and 1.2264. The classic pivot levels (1.2187 – 1.2247) interim resistance may act as interim resistance today. The key levels today are clustered between 1.2087 and 1.2107 represented by the central pivot level and a one-week long-term trend line. If the instrument settles lower and reverses its trajectory, this could change the balance of trading forces. The other intraday targets are seen as support levels of classic pivot levels (1.2047 – 1.1987 – 1.1947).

***

This technical analysis is based on the following ideas:

Larger timeframes - Ichimoku Kinko Hyo (9.26.52) + Fibo Kijun levels

Smaller timeframes - H1 – classic pivot points + 120-period Moving Average (weekly long-term trend line)

รับผลกำไรจากการเปลี่ยนแปลงอัตราสกุลเงินดิจิทัลกับ InstaForex.
ดาวน์โหลด MetaTrader 4 และเปิดการซื้อขายครั้งแรกของคุณ.
  • Grand Choice
    Contest by
    InstaForex
    InstaForex always strives to help you
    fulfill your biggest dreams.
    เข้าร่วมการแข่งขัน
  • Chancy Deposit
    ฝากเงินในบัญชีของคุณใน $3,000 และรับ $8000 ไปเพิ่ม!
    ใน มีนาคม ทางเราได้ออก$8000 ภายในแคมเปญ Chancy Deposit !
    คว้าโอกาสที่จะชนะด้วยการฝากเงิน $3,000 ไปในบัญชีเทรด เมื่อทำตามเงื่อนไขนี้แล้ว คุณก็จะกลายเป็นผู้เข้าร่วมแคมเปญ
    เข้าร่วมการแข่งขัน
  • เทรดให้ดีแล้วคว้ารางวัล
    เติมเงินในบัญชีของคุณอย่างน้อย $500 สมัครเข้าร่วมการแข่งขัน และลุ้นรับรางวัลอุปกรณ์ติดต่อสื่อสารแบบพกพา
    เข้าร่วมการแข่งขัน
  • โบนัส 100%
    โอกาสพิเศษของคุณในการรับโบนัส 100% จากเงินฝากของคุณ
    รับโบนัส
  • โบนัส 55%
    สมัครรับโบนัส 55% สำหรับการฝากทุกครั้ง
    รับโบนัส
  • โบนัส 30%
    รับโบนัส 30% ทุกครั้งที่คุณเติมเงินในบัญชีของคุณ
    รับโบนัส


บทความแนะนำ

หากไม่สะดวกคุยในตอนนี้
ระบุคำถามไว้ได้ใน แชท.
Widget callback