GBP/USD 5M
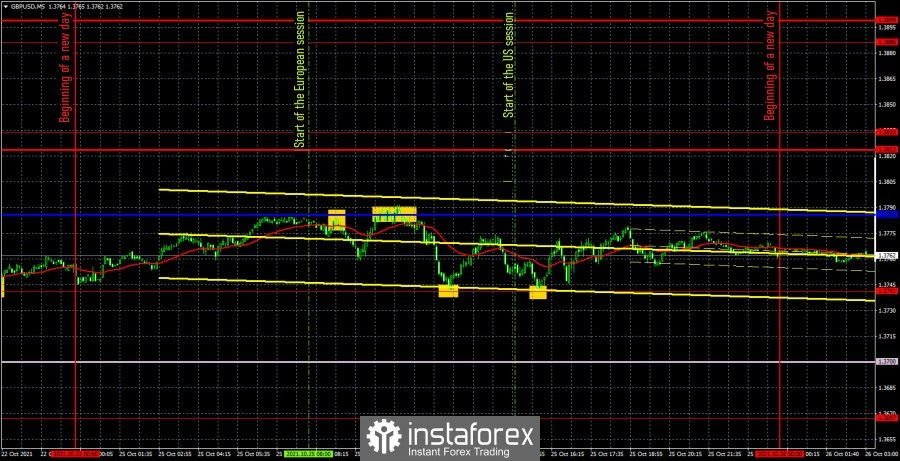
The GBP/USD pair was trading rather weakly and mostly sideways on October 25. It feels like the euro and the pound have changed places on Monday, as the euro was trading quite well, while the pound was flat. The volatility of the pound/dollar pair was only 49 points, that is, less than for the euro/dollar. Nevertheless, several pretty good trading signals were formed during the day, which could and should have been worked out. Let's consider them in detail. At the beginning of the European session, the price bounced off the Kijun-sen line, and did so twice. Any of these signals could be used to open short positions. Subsequently, the price dropped to the extremum level of 1.3741 and rebounded from it (error 1 point). Thus, at this moment, it was necessary to close short positions and open long ones. The profit was 25 points. After a rebound from the level of 1.3741, the pair was able to go up only 25 points, which was enough to set Stop Loss to breakeven, at which the long position was closed, as the price returned to the level of 1.3741. Another rebound followed, which should also have been worked out with a long position. This trade was already profitable as it had to be closed manually in the late afternoon. On it, the profit amounted to about 18 points. Thus, 43 points gained on the day when the pair passed only 49, which is an excellent result. No unprofitable deals opened on the euro and the pound on Monday.
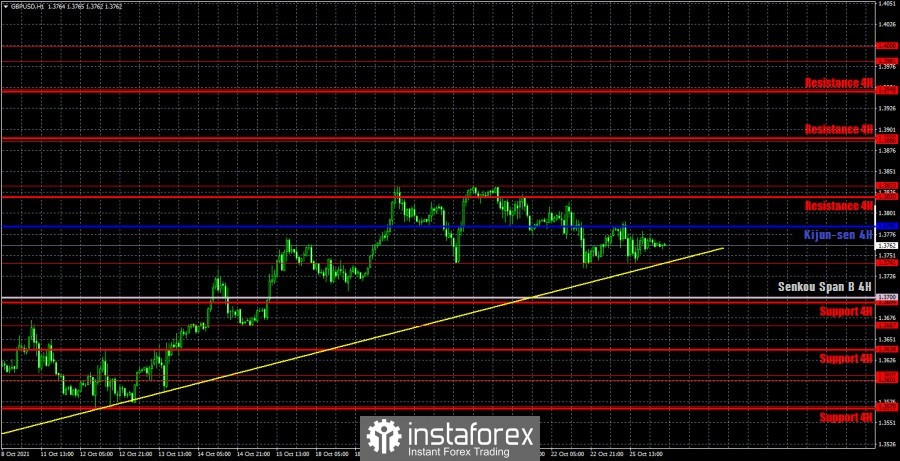
GBP/USD 1H

The pound/dollar pair maintains an upward trend on the hourly timeframe, as it continues to be located above the trend line. The bulls did not manage to overcome the level of 1.3833, so we are already witnessing the second round of correction against the upward trend. If the bulls manage to keep the pair above the uptrend line, then the price may return to the level of 1.3833 and try to overcome it for the fourth time. In any case, the upward trend continues. However, if the price settles below the trendline, then the upward trend will be disrupted and the chances of a downward move will increase. Especially if the Senkou Span B line is crossed. The pound has risen quite well in recent weeks, so a correction is even more preferable now. We highlight the following important levels on October 26: 1.3667, 1.3741, 1.3833, 1.3886. Senkou Span B (1.3700) and Kijun-sen (1.3785) lines can also be signal sources. It is recommended to set the Stop Loss level at breakeven when the price passes 20 points in the right direction. The Ichimoku indicator lines can move during the day, which should be taken into account when looking for trading signals. Nothing interesting and important planned in the UK on Tuesday, and only the consumer confidence indicator will be published in the US. Thus, we can assume that there will be no macroeconomic background. However, it is very unusual for volatility to be equal to 50 points for the pound, so today we still expect a more active movement of the pair.
We recommend you to familiarize yourself:
Overview of the EUR/USD pair. October 26. Traders are beginning to believe again in the collapse of QE in November.
Overview of the GBP/USD pair. October 26. Janet Yellen: we control inflation.
Forecast and trading signals for EUR/USD for October 26. Detailed analysis of the movement of the pair and trade deals.
COT report

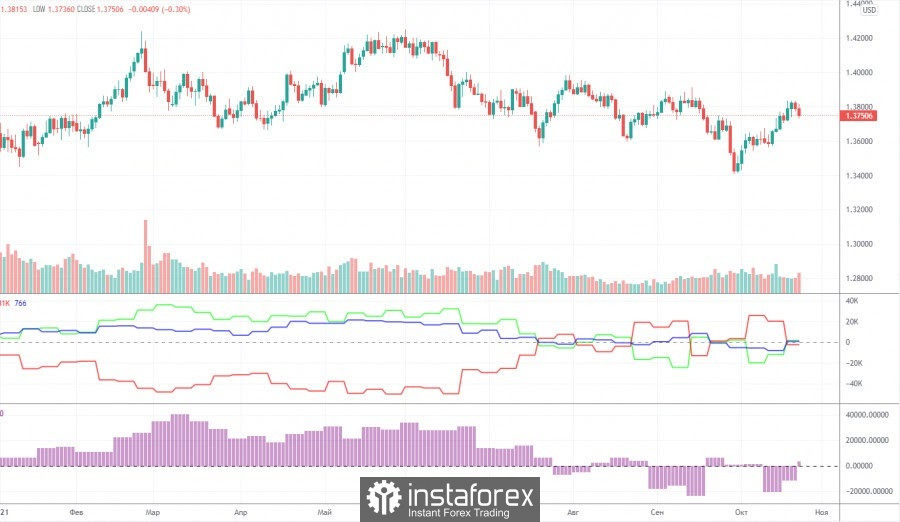
The mood of professional traders became less bearish again during the last reporting week (October 12-18). The situation with the Commitment of Traders (COT) reports is now even more ambiguous than with the technical picture. And if we compare the COT reports for the euro and the pound, then the situation becomes even stranger. Both indicators in the chart above show that large players do not have any clear, precise and understandable mood at the moment. Consequently, now it is simply impossible to make any forecasts based on COT reports. In principle, the chart above clearly shows the entire movement of the pair over the past year. It is rather difficult to call it a trend or even a trend. In the last couple of months, the mood of the big players has been constantly changing. The green and red lines of the first indicator (net positions of groups of traders "commercial" and "non-commercial") are constantly changing the direction of movement. This means that the two largest groups of traders are constantly increasing and decreasing their net positions. During the reporting week, professional traders opened 2,000 buy contracts (longs) and closed 12.5 thousand sell contracts (shorts). Thus, their net position increased by 10.5 thousand contracts. This is in line with what has been happening with the pound in recent weeks (it is rising). Nevertheless, it is impossible to make a long-term forecast, since the net position may fall already by the end of next week. We also pay attention to the fact that the green and red lines of the first indicator are not moving towards each other and are not moving away from each other. Therefore, it is also impossible to talk about any trend now.
Explanations for the chart:
Support and Resistance Levels are the levels that serve as targets when buying or selling the pair. You can place Take Profit near these levels.
Kijun-sen and Senkou Span B lines are lines of the Ichimoku indicator transferred to the hourly timeframe from the 4-hour one.
Support and resistance areas are areas from which the price has repeatedly rebounded off.
Yellow lines are trend lines, trend channels and any other technical patterns.
Indicator 1 on the COT charts is the size of the net position of each category of traders.
Indicator 2 on the COT charts is the size of the net position for the non-commercial group.