Here are the details of the economic calendar for January 21, 2021:
The UK's retail sales in December declined by 3.7% compared to November and by 0.9% compared to December 2020.
The Deputy Director of the British Office of National Statistics, Heather Bovill, said that retail sales in all categories declined in December after strong pre-Christmas sales in November, and retailers suspect traffic was affected by Omicron.
Pandemic restrictions, which are tighter than before in connection with the spread of Omicron, meant that more people were working from home, indicating that fuel sales have significantly decreased.
The pound sterling came under pressure after the devastating retail sales data, and as a result, it continued to decline.
Analysis of trading charts from January 21:
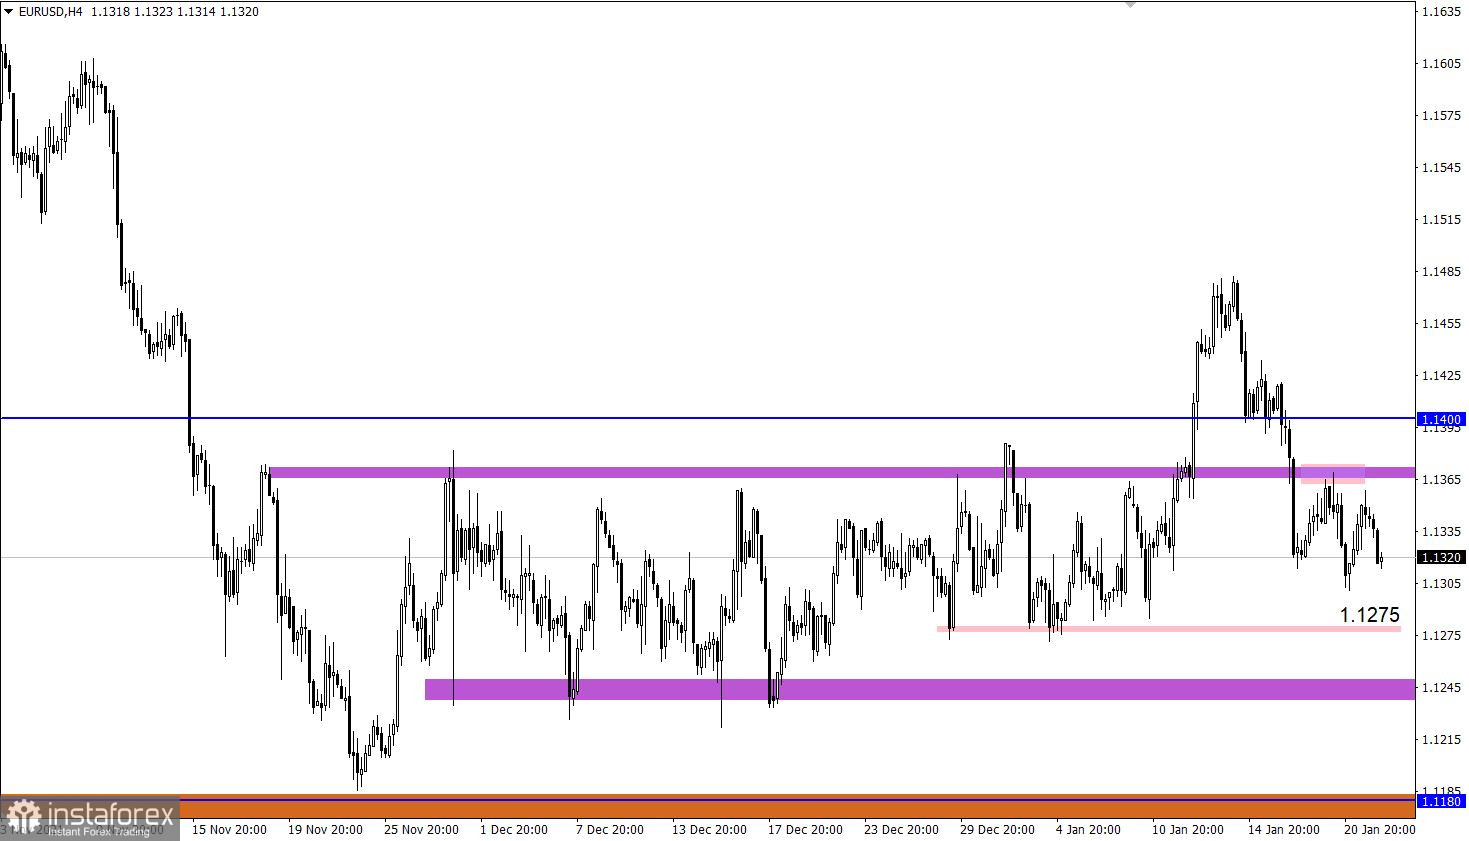
The EUR/USD pair rebounded from the resistance level of 1.1370 again, where the upper border of the side channel passed earlier in history. This led to an increase in the volume of short positions, which increases the chances of sellers for the subsequent weakening of the euro.
On the daily chart, there is a recovery relative to the corrective movement, where the US dollar managed to restore positions by more than half.
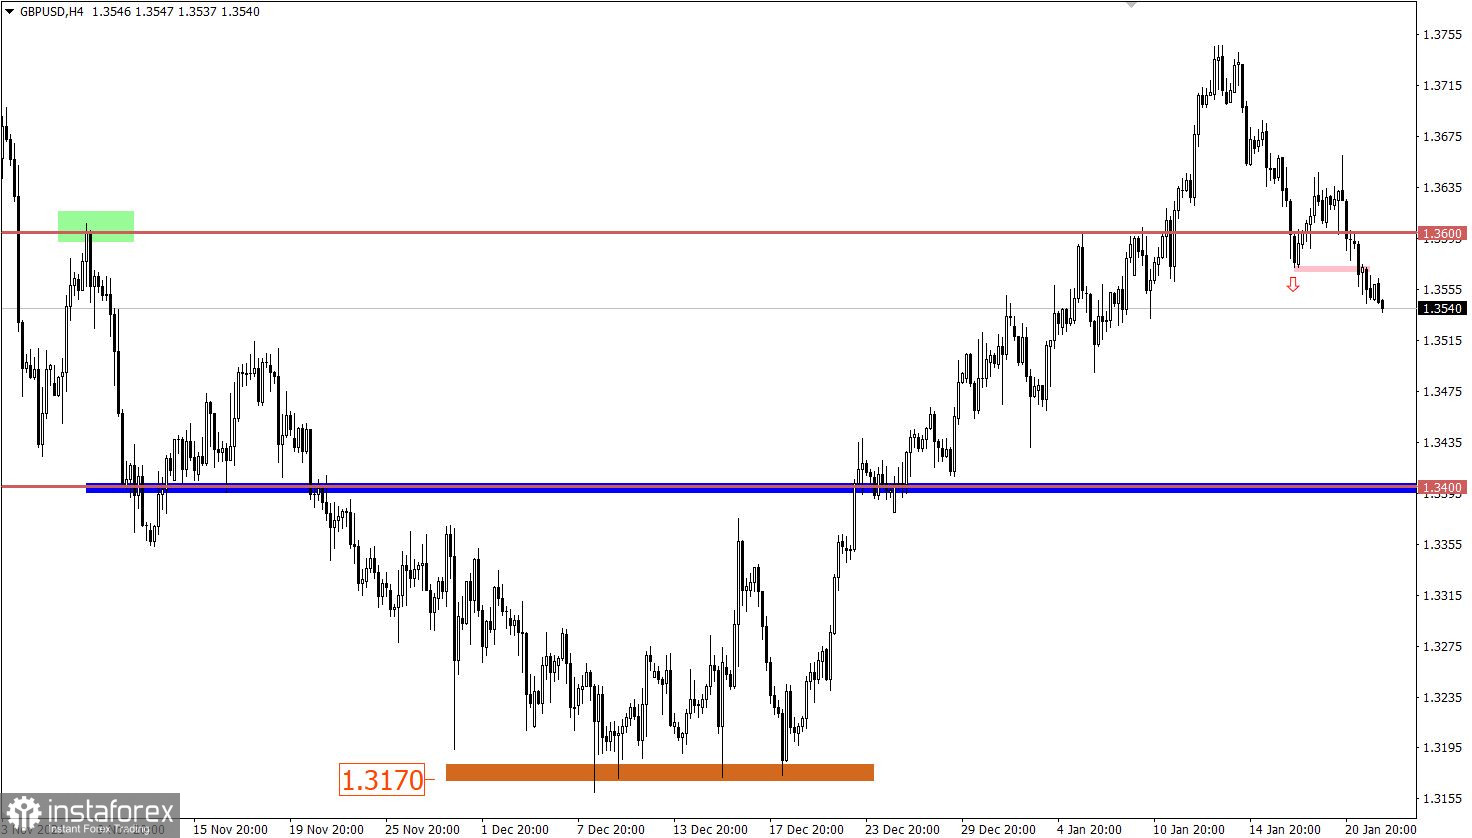
A short stagnation on the GBP/USD pair along the level of 1.3600 increased the downward interest. The signal to sell the pound was received after holding the price below the local low (1.3572) on January 18. This move led to an increase in the volume of short positions.
On the daily chart, there is a gradual change in trading interests, where there has been no update of the local high since January 13. Therefore, traders agree that there is a recovery in the market relative to the upward cycle.
January 24 economic calendar:
Today, the preliminary data on business activity in Europe, the UK, and the United States for January will be released.
Details of statistical data:
9:00 Universal time - The index of business activity in the European services sector: Prev. 53.1 points; Forecast 52.2 points.
9:00 Universal time - The index of business activity in the manufacturing sector in Europe: Prev. 58.0 points; Forecast 57.5 points.
9:30 Universal time - The index of business activity in the UK services sector: Prev. 53.6 points; Forecast 55.0 points.
9:30 Universal time - The index of business activity in the manufacturing sector in the UK: Prev. 57.9 points; Forecast 57.9 points.
13:45 Universal time - The index of business activity in the US services sector: Prev. 57.6 points; Forecast 55.0 points.
13:45 Universal time - The index of business activity in the US manufacturing sector: Prev. 57.7 points; Forecast 56.8 points.
* The index of business activity in the service sector is an indicator that is determined based on a survey of managers of companies working in the service sector in order to assess the current situation in this sector, as well as possible prospects.
* The index of business activity in the manufacturing sector is an indicator of changes in business conditions in the industrial sector in the reporting month. The index is calculated on the basis of monthly surveys of supply managers working in private companies in the manufacturing sector.
Trading plan for EUR/USD on January 24:
The quote is still above last week's local low despite the price rebound from the resistance area, thereby slowing down the pace of the downward cycle. The signal for the euro's subsequent sale will be received if the price holds below the level of 1.1300. In this case, the chance of moving towards the levels of 1.1275 and 1.1230 increases several times.
Trading plan for GBP/USD on January 24:
In this situation, the downward mood may strengthen positions if the price holds below the level of 1.3530. This will lead to the pound's subsequent weakening towards the zone of 1.3500-1.3400.
Traders will consider an alternative scenario for the development of the market if a stop occurs relative to the current values. This will lead to the formation of stagnation within the borders of 1.3540/1.3580.
What is reflected in the trading charts?
A candlestick chart view is graphical rectangles of white and black light, with sticks on top and bottom. When analyzing each candle in detail, you will see its characteristics of a relative period: the opening price, closing price, and maximum and minimum prices.
Horizontal levels are price coordinates, relative to which a stop or a price reversal may occur. These levels are called support and resistance in the market.
Circles and rectangles are highlighted examples where the price of the story unfolded. This color selection indicates horizontal lines that may put pressure on the quote in the future.
The up/down arrows are the reference points of the possible price direction in the future.