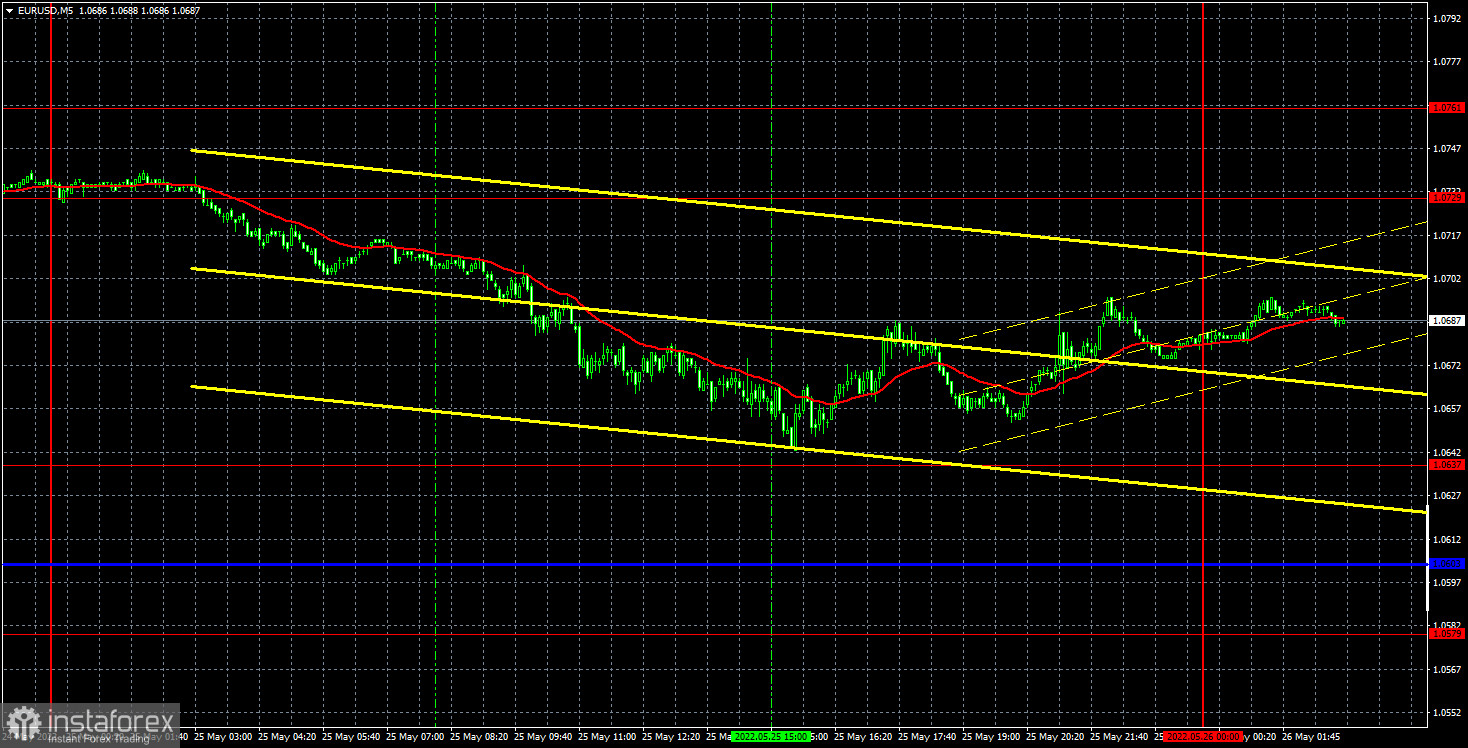
EUR/USD 5M
Yesterday, the EUR/USD pair began a downward correction against the uptrend supported by the trend line. There were few macroeconomic statistics during the past day. We can only note the report on orders for durable goods in the US, which turned out to be slightly worse than forecasts. After that, the US currency fell slightly, but this report did not even affect the movement within the day. Thus, despite the correction, the euro retains good chances for technical growth, because, recall, the current growth of the pair itself is, in fact, a correction against a long downward trend. Thus, this factor alone can continue to support the demand for the euro. The volatility of the environment was again high, over 100 points, so if there are trading signals, then trading is very pleasant. Unfortunately, trading signals are not always available.
Yesterday, for example, there were none. During the night, the pair broke the extreme level of 1.0729, but this sell signal was formed at night, so it could not be worked out. At the opening of the European trading session, the price has already quite noticeably moved away from the point of forming this signal, so it was not possible to open short positions "after" either. At the beginning of the US trading session, the pair fell to the level of 1.0637, but did not reach it by just a few points, so in this case, traders were deprived of a trading signal. In general, it turned out to be a day when the movement was very good, but each time there was just a little bit missing to open a profitable trade.
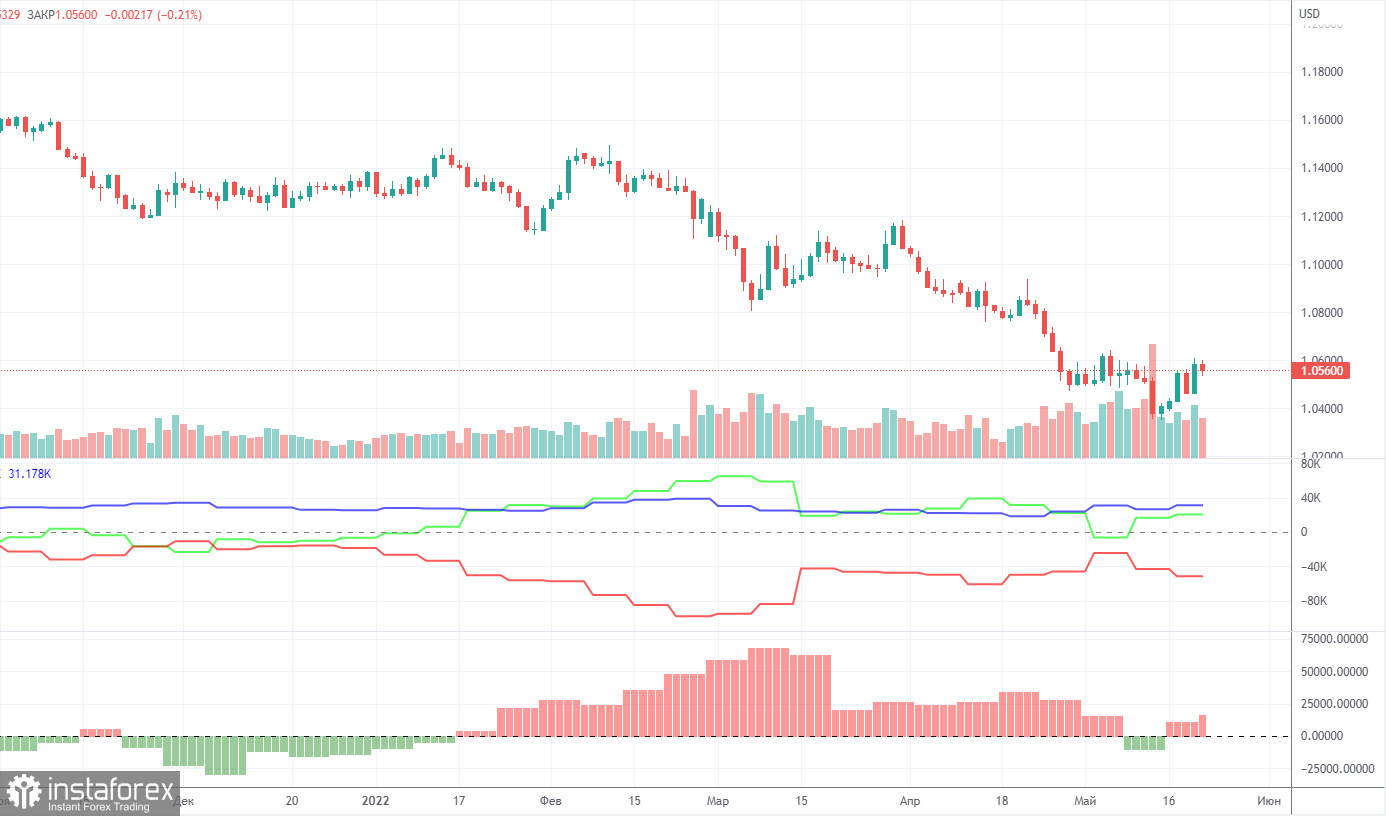
COT report:
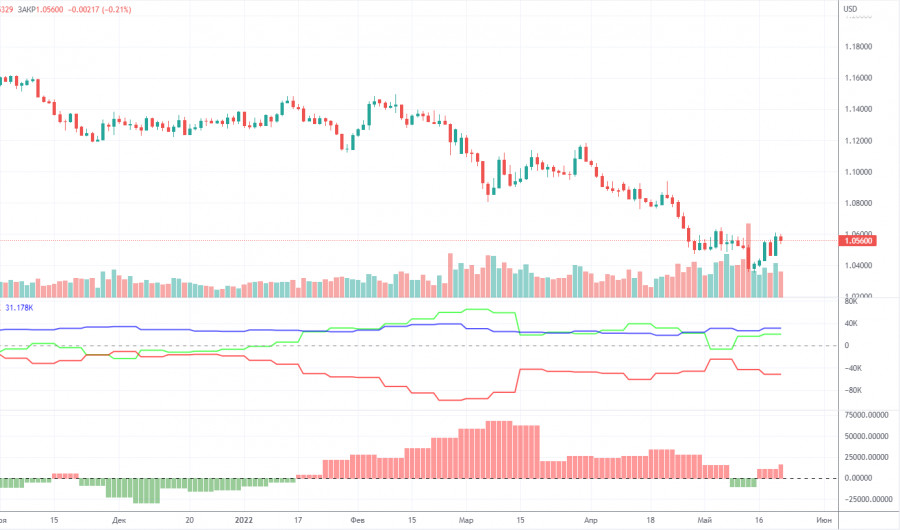
The latest Commitment of Traders (COT) reports on the euro caused and continue to raise more and more questions. The COT report showed the bearish mood of major players only once in the past few months, but in the last two weeks, the bullish mood is intensifying again. That is, a paradoxical situation remains, in which the euro currency has been falling for a long time, but professional players are buying up the euro, and not selling it. During the reporting week, the number of long positions increased by 2,500, while the number of shorts in the non-commercial group decreased by 1,200. Thus, the net position grew by 3,700 contracts per week. The number of longs exceeds the number of shorts for non-commercial traders by 20,000. From our point of view, this happens because the demand for the US dollar is much higher than the demand for the euro. Even if someone suggested that the whole point is the weakening of the bullish mood in recent months (the second indicator is the histogram), then this is hardly the case. The euro simply refuses to grow, despite any actions of major players. The chart above clearly shows that the euro fell both when the net position grew (increasing bullish sentiment) and when the net position decreased (weakened bullish sentiment). Thus, it is still impossible to draw a correlation between COT reports and what is happening in the market. It makes no sense to build forecasts on such data, all the more.
We recommend that you familiarize yourself with:
Overview of the EUR/USD pair. May 26. Christine Lagarde: The EU must learn important lessons from the military conflict in Ukraine.
Overview of the GBP/USD pair. May 26. The Fed's rhetoric remains hawkish, meanwhile the pound is correcting and hopes for new growth.
Forecast and trading signals for GBP/USD on May 26. Detailed analysis of the movement of the pair and trading transactions.
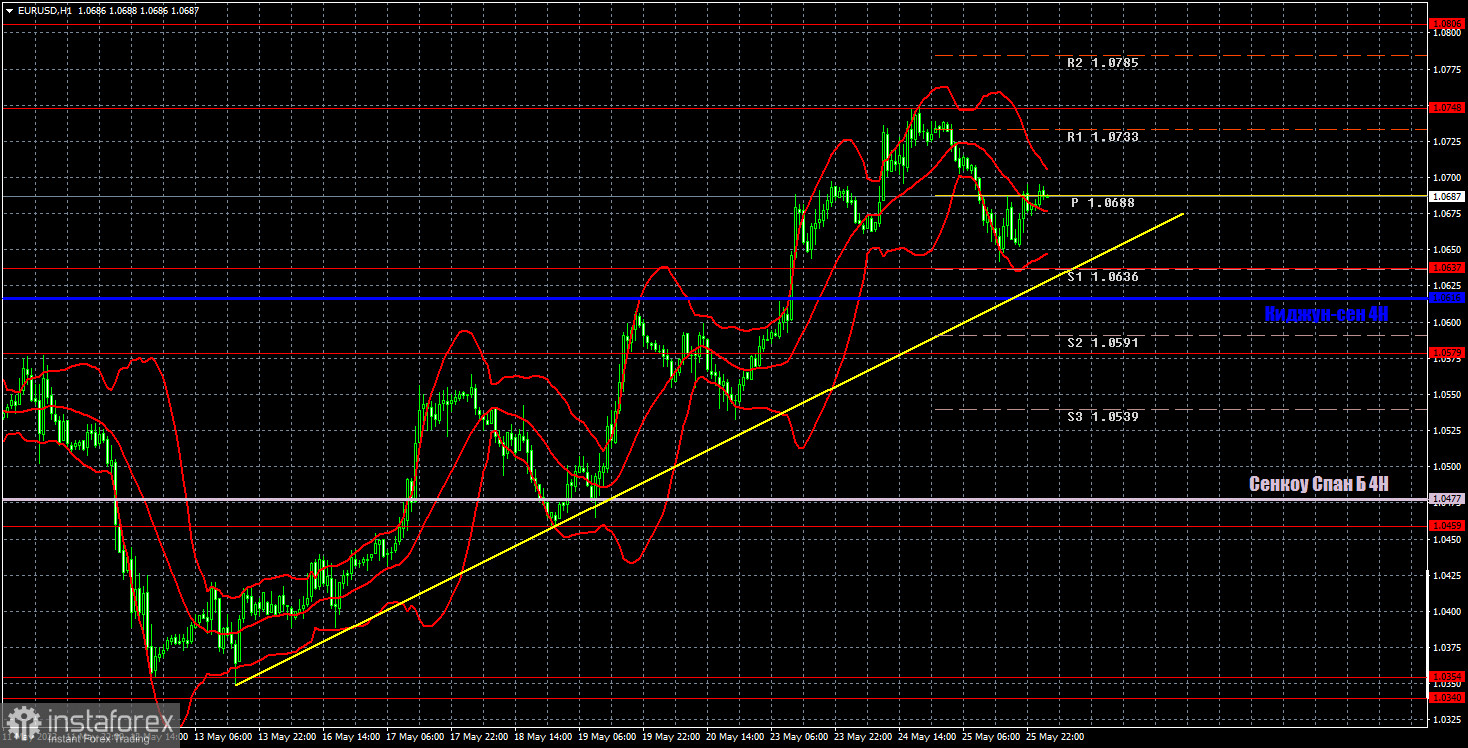
EUR/USD 1H
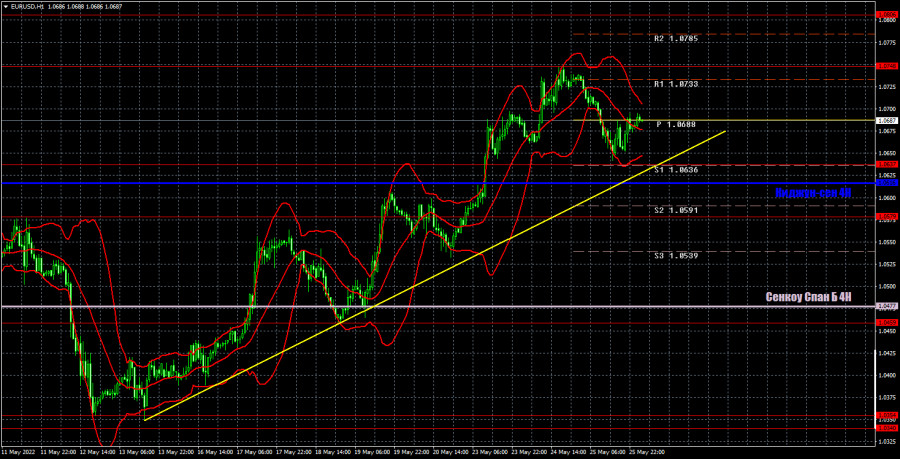
It is clearly seen on the hourly timeframe that the ascending trend line remains relevant. Despite the fact that the euro's growth is now purely technical, there is a trend, which means you should trade on it. If the pair settles below the trend line, then the downward trend may resume, because the price has not yet moved far enough from its 20-year lows to consider the trend absolutely complete. Today we highlight the following levels for trading - 1.0459, 1.0579, 1.0637, 1.0748, 1.0806, as well as Senkou Span B (1.0477) and Kijun-sen (1.0616) lines. Ichimoku indicator lines can move during the day, which should be taken into account when determining trading signals. There are also secondary support and resistance levels, but no signals are formed near them. Signals can be "rebounds" and "breakthrough" extreme levels and lines. Do not forget about placing a Stop Loss order at breakeven if the price has gone in the right direction for 15 points. This will protect you against possible losses if the signal turns out to be false. Nothing interesting planned for today in the European Union, and in the US - only the GDP report for the first quarter in the second assessment. This report may push traders to react if its actual value differs from the previous one (-1.4% Q/Q). There will be nothing more interesting in the US.
Explanations for the chart:
Support and Resistance Levels are the levels that serve as targets when buying or selling the pair. You can place Take Profit near these levels.
Kijun-sen and Senkou Span B lines are lines of the Ichimoku indicator transferred to the hourly timeframe from the 4-hour one.
Support and resistance areas are areas from which the price has repeatedly rebounded off.
Yellow lines are trend lines, trend channels and any other technical patterns.
Indicator 1 on the COT charts is the size of the net position of each category of traders.
Indicator 2 on the COT charts is the size of the net position for the non-commercial group.