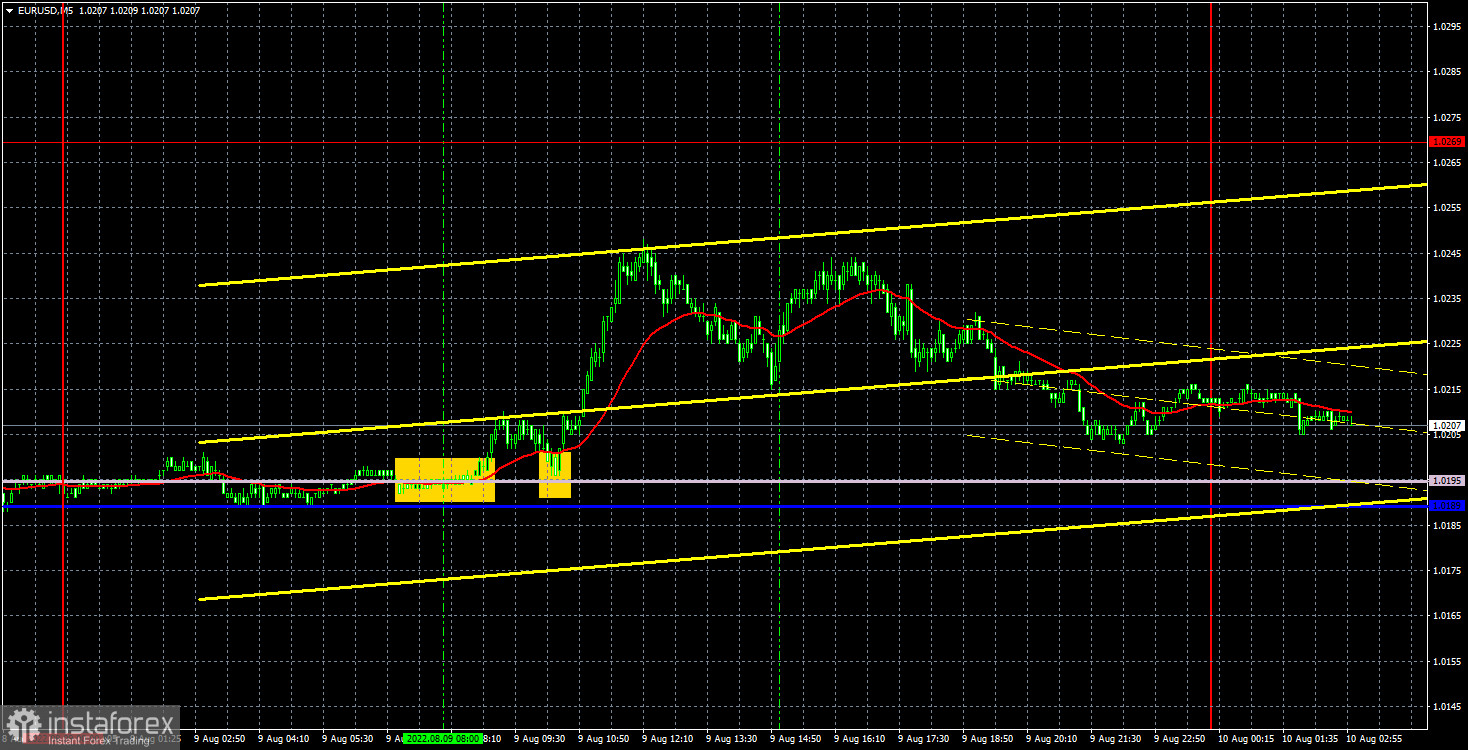
EUR/USD 5M
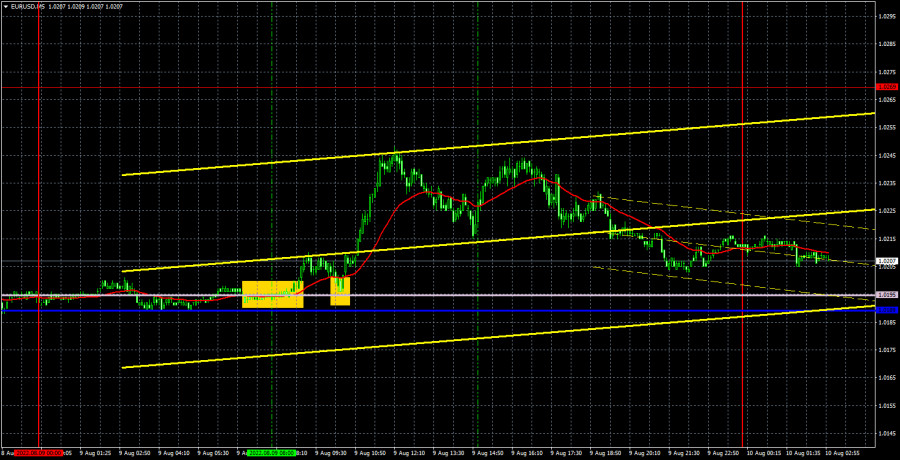
The EUR/USD pair showed an upward movement on Tuesday, however, inside the same horizontal channel, which we have been writing about for several weeks in a row, just every day. The fact is that until the pair leaves this channel, the technical picture will definitely not change. The price will hang between the levels of 1.0120 and 1.0269, between which there are no other levels, but only the Ichimoku indicator lines, which are weak in a flat. That is, it is very difficult to trade in such conditions, and all traders enter the currency market in order to trade and make a profit, and not just watch how the pair moves in a flat. Thus, at this time, traders must decide for themselves whether they want to trade in such conditions or would it be better to wait for the end of the flat and the restoration of the trend movement? Naturally, there were no important macroeconomic events either in America or in the European Union on Tuesday, and the pair's volatility was very low, which further affected the desire to trade the pair.
Strange as it may seem, only two trading signals were formed on Tuesday. They duplicated each other and at the same time even allowed traders to earn during the day. However, we believe that this is a lucky coincidence, not a pattern. The price bounced off the Senkou Span B line twice during the European trading session, where traders could open long positions. Subsequently, the pair rose by 40-50 points, but could not work out either the nearest target level of 1.0269 or return to the Senkou Span B line. Therefore, this deal had to be closed manually in the late afternoon and 30 points could have been earned on it.
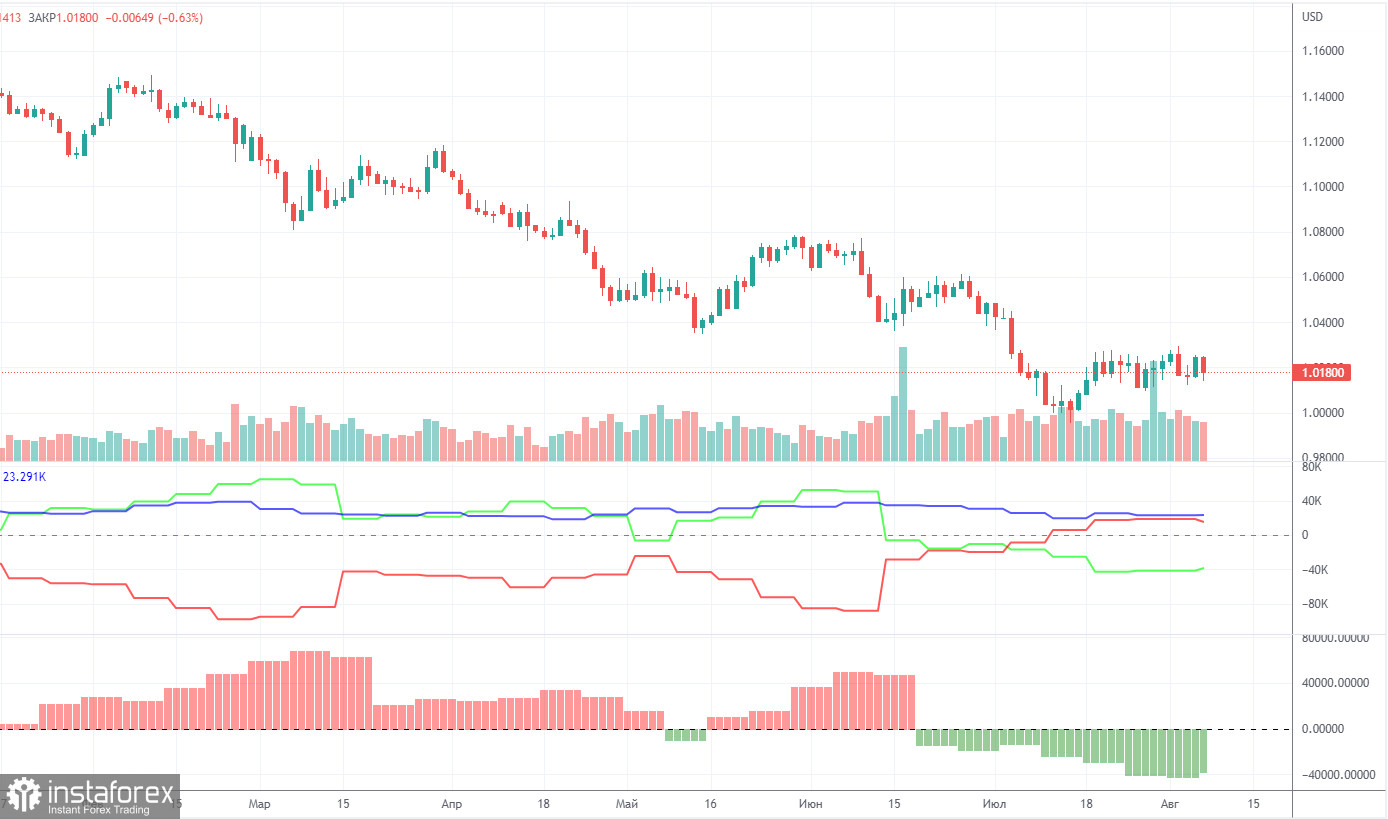
COT report:
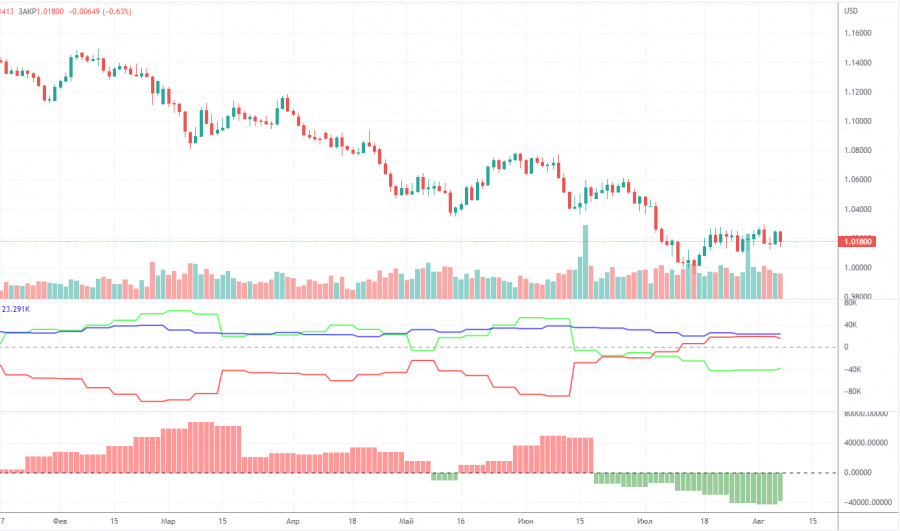
The Commitment of Traders (COT) reports on the euro over the past six months have raised a huge number of questions. The chart above clearly shows that for most of 2022 they showed an open bullish mood of professional players, but at the same time, the euro was falling at the same time. At this time, the situation has changed, but NOT in favor of the euro. If earlier the mood was bullish, and the euro was falling, now the mood is bearish and... the euro is also falling. Therefore, for the time being, we do not see any grounds for the euro's growth, because the vast majority of factors remain against it. During the reporting week, the number of long positions decreased by 6,300, while the number of shorts in the non-commercial group decreased by 9,100. Accordingly, the net position increased by about 3,000 contracts, which is a meager change. The mood of the big players remains bearish and has steadily intensified in recent weeks. From our point of view, this fact very eloquently indicates that at this time even commercial traders do not believe in the euro. The number of longs is lower than the number of shorts for non-commercial traders by 39,000. Therefore, we can state that not only the demand for the US dollar remains high, but also the demand for the euro is quite low. This may lead to a new, even greater fall of the euro. Over the past six months or a year, the euro has not been able to show even a tangible correction, not to mention something more. The highest upward movement was about 400 points. Over the past three weeks, the pair has managed to correct by 300 points.
We recommend to familiarize yourself with:
Overview of the EUR/USD pair. August 10. The European Union fears a gas war with Russia, so it is working on various plans.
Overview of the GBP/USD pair. August 10. The pound has several growth factors, but the dollar's positions still look stronger.
Forecast and trading signals for GBP/USD on August 10. Detailed analysis of the movement of the pair and trading transactions.
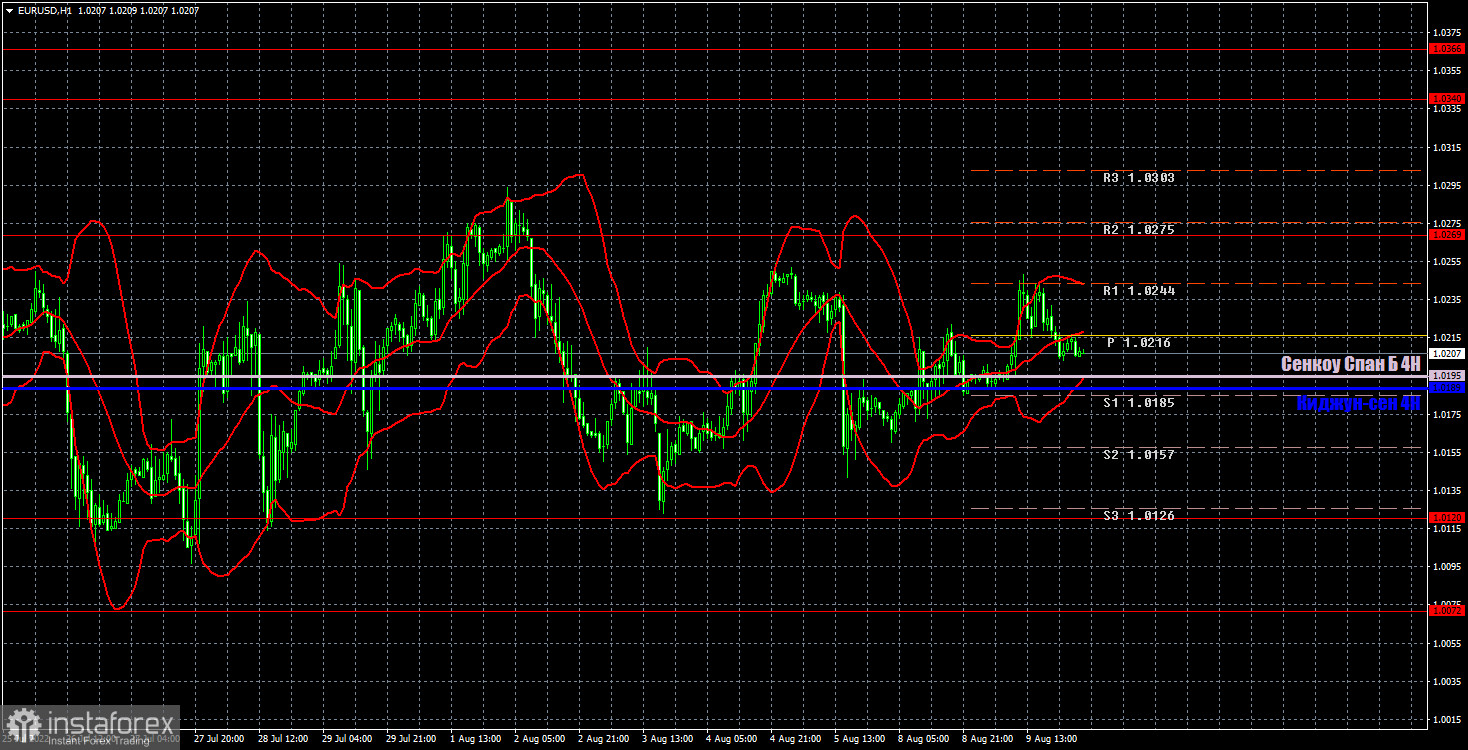
EUR/USD 1H
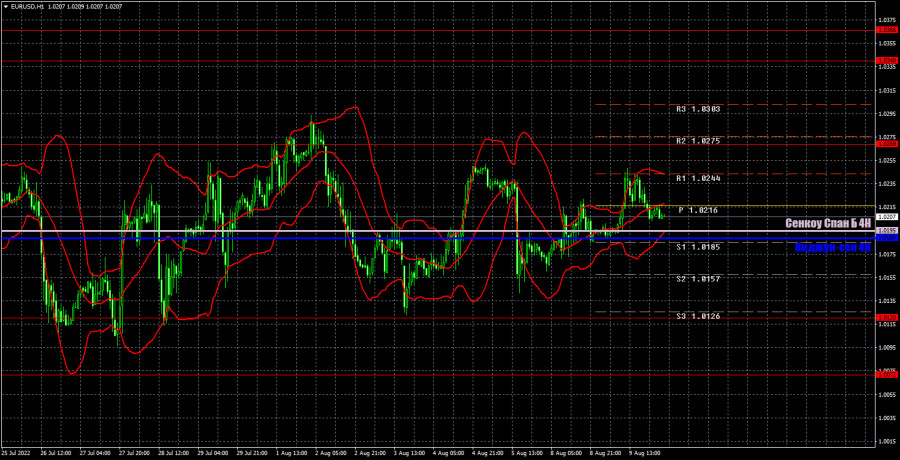
The pair continues to trade between the levels of 1.0120 and 1.0269 on the hourly timeframe. Accordingly, the flat is preserved. The lines of the Ichimoku indicator are currently very weak and strong signals are not formed around them (but exceptions also happen). Therefore, traders need to decide for themselves now whether they want to trade the pair in an open flat? So far, we do not see the prerequisites for its completion. We allocate the following levels for trading on Wednesday - 1.0000, 1.0072, 1.0120, 1.0269, 1.0340-1.0366, 1.0485, as well as Senkou Span B (1.0189) and Kijun-sen lines (1.0195). Ichimoku indicator lines can move during the day, which should be taken into account when determining trading signals. There are also secondary support and resistance levels, but no signals are formed near them. Signals can be "rebounds" and "breakthrough" extreme levels and lines. Do not forget about placing a Stop Loss order at breakeven if the price has gone in the right direction for 15 points. This will protect you against possible losses if the signal turns out to be false. No important report or fundamental event scheduled again in the European Union for today. Traders will have to only react to the inflation report in the US, but even it does not guarantee that the price will exit the horizontal channel.
Explanations for the chart:
Support and Resistance Levels are the levels that serve as targets when buying or selling the pair. You can place Take Profit near these levels.
Kijun-sen and Senkou Span B lines are lines of the Ichimoku indicator transferred to the hourly timeframe from the 4-hour one.
Support and resistance areas are areas from which the price has repeatedly rebounded off.
Yellow lines are trend lines, trend channels and any other technical patterns.
Indicator 1 on the COT charts is the size of the net position of each category of traders.
Indicator 2 on the COT charts is the size of the net position for the non-commercial group.