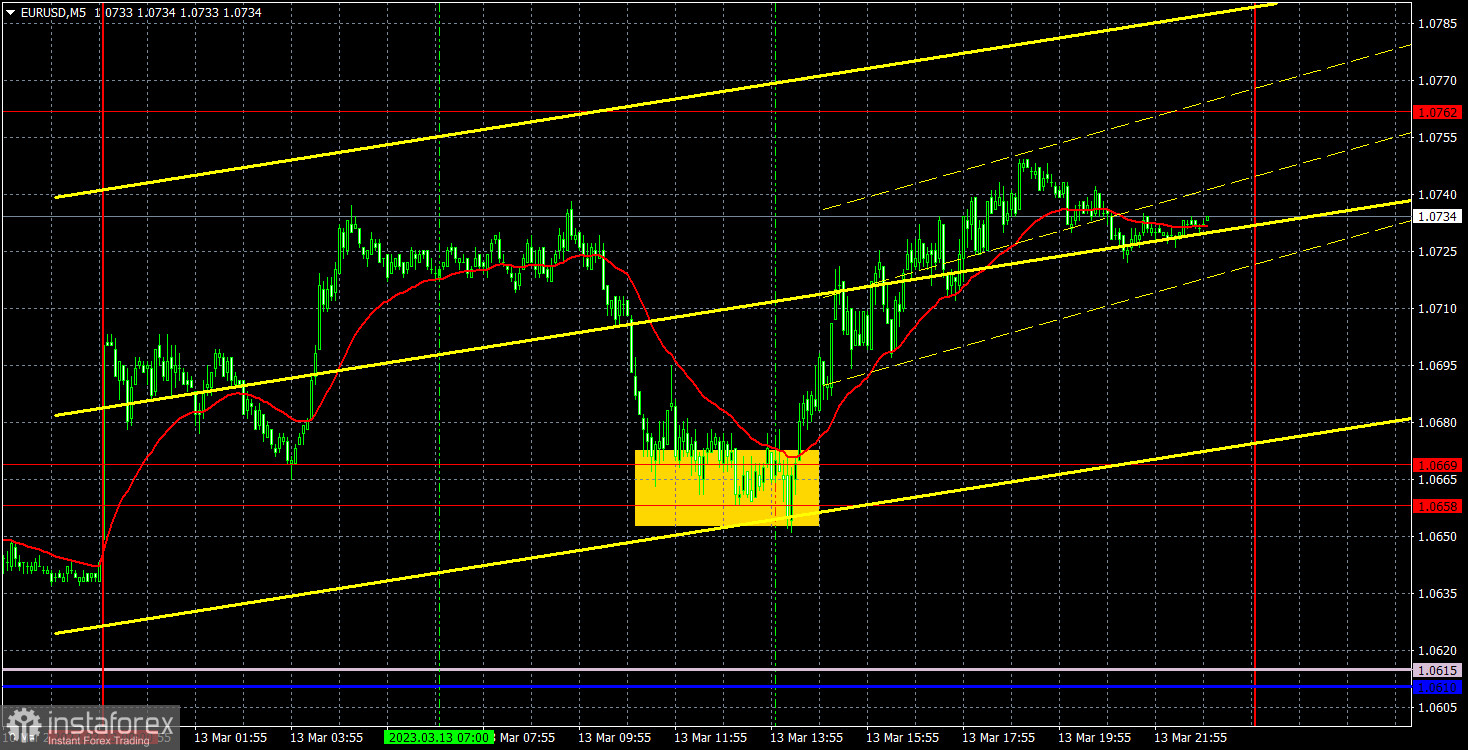
5M chart of EUR/USD
On Monday, EUR/USD continued to trade in "Friday mode". That is, quite volatile and at the same time, with a clear upward bias. In our fundamental article, we have already analyzed the reasons for the euro's growth (or more exactly, the dollar's fall). On the 5-minute chart, you can see that the pair managed to grow considerably as well as fall during the day. And this happened despite the fact that there were no macro data released during the day. However, U.S. President Joe Biden delivered a speech and the FOMC meeting was held, at which the issue of the stability of the banking system after the collapse of two large banks was decided. This news became the drivers on Monday, though it was rather difficult to say which one of them had an effect on the pair and at what time.
Speaking of yesterday's trading signals, everything was as simple as possible. The price fell to the area of 1.0658-1.0669 in the middle of the European session, from which it bounced. After a buy signal appeared, the pair went up about 50 pips, which traders could take advantage of by opening a long position and closing it manually in the evening. So, the day was quite good, in terms of trading. Although the movements, of course, were mixed.
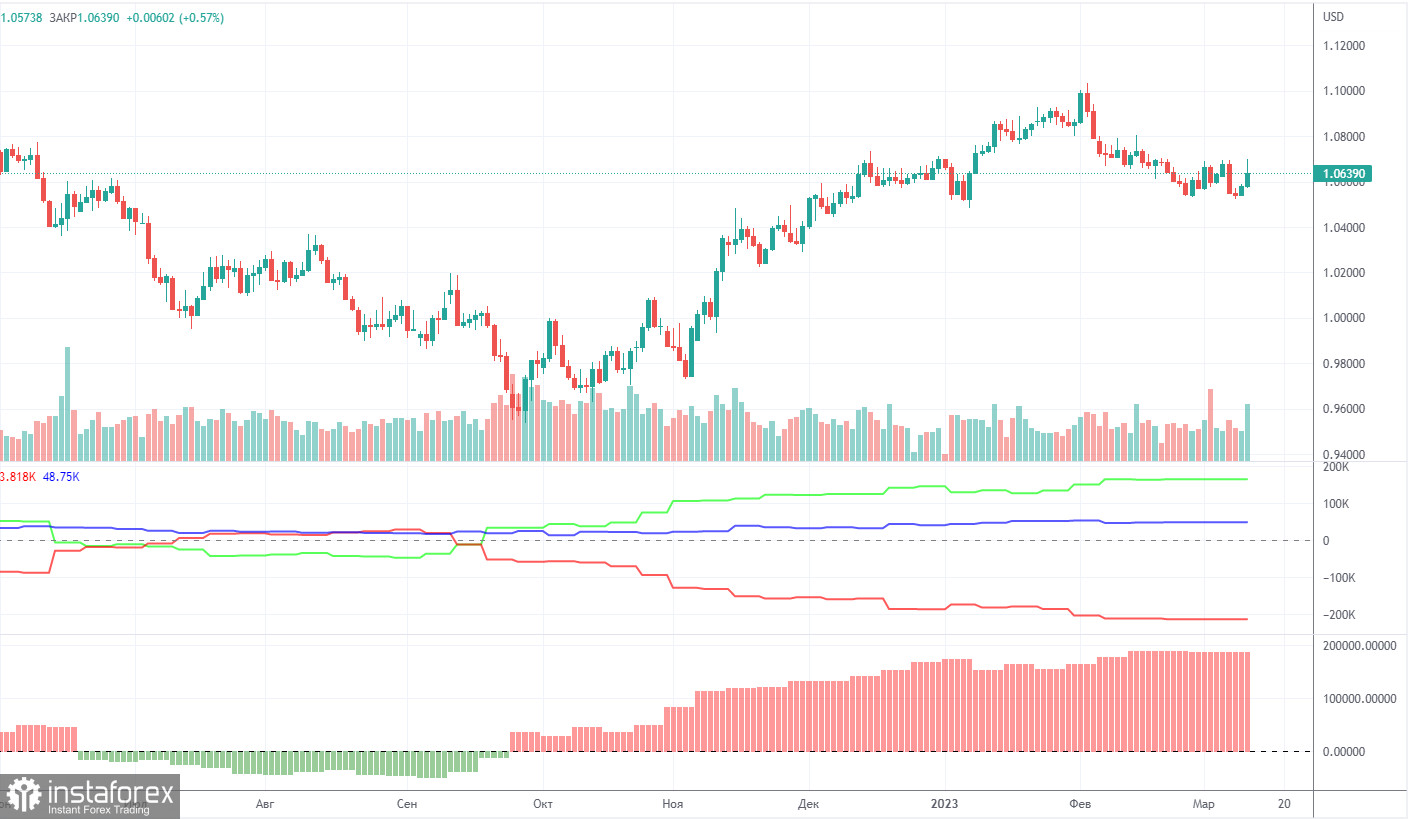
COT report:
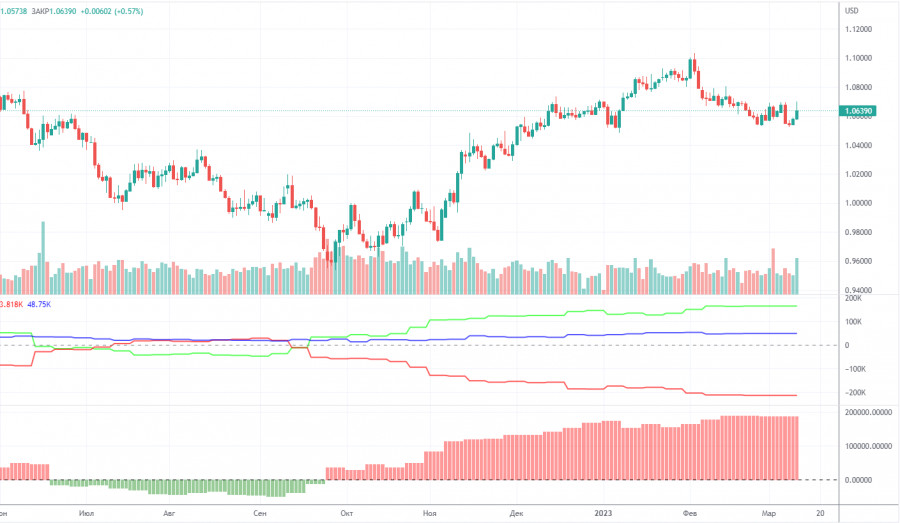
A new COT report came out on Friday... for February 21... That was almost a month ago, while the report of February 14 has disappeared... It seems that the Commodity Futures Trading Commission will now publish reports with a month's delay for some time. In the event of this, the reports will hardly be of great importance. Recall that there was a technical glitch in the CFTC, so the data we receive now is considered irrelevant. So far, we can say that in the last few months, the overall picture has been corresponding to the market situation. On the chart above, we see that the net non-commercial position of large traders (second indicator) has risen since September 2022. At about the same time, the euro started to rise. The net non-commercial position is bullish and continues to increase with each new week, allowing us to expect the uptrend to stop shortly. Such a signal comes from the first indicator, with the green line and the red line being far apart, which is usually a sign of the end of a trend. The euro has already begun its bearish move against the greenback. So far, it remains unclear whether it is just a bearish correction or a new downtrend? According to the latest report, non-commercial traders closed 100 long positions, and 1,300 short ones. Consequently, the net position rose by 1,200. The number of long positions exceeds that of short ones by 165,000. In any case, a correction has been looming for a long time. Therefore, even without reports, it is clear that the downtrend will continue.
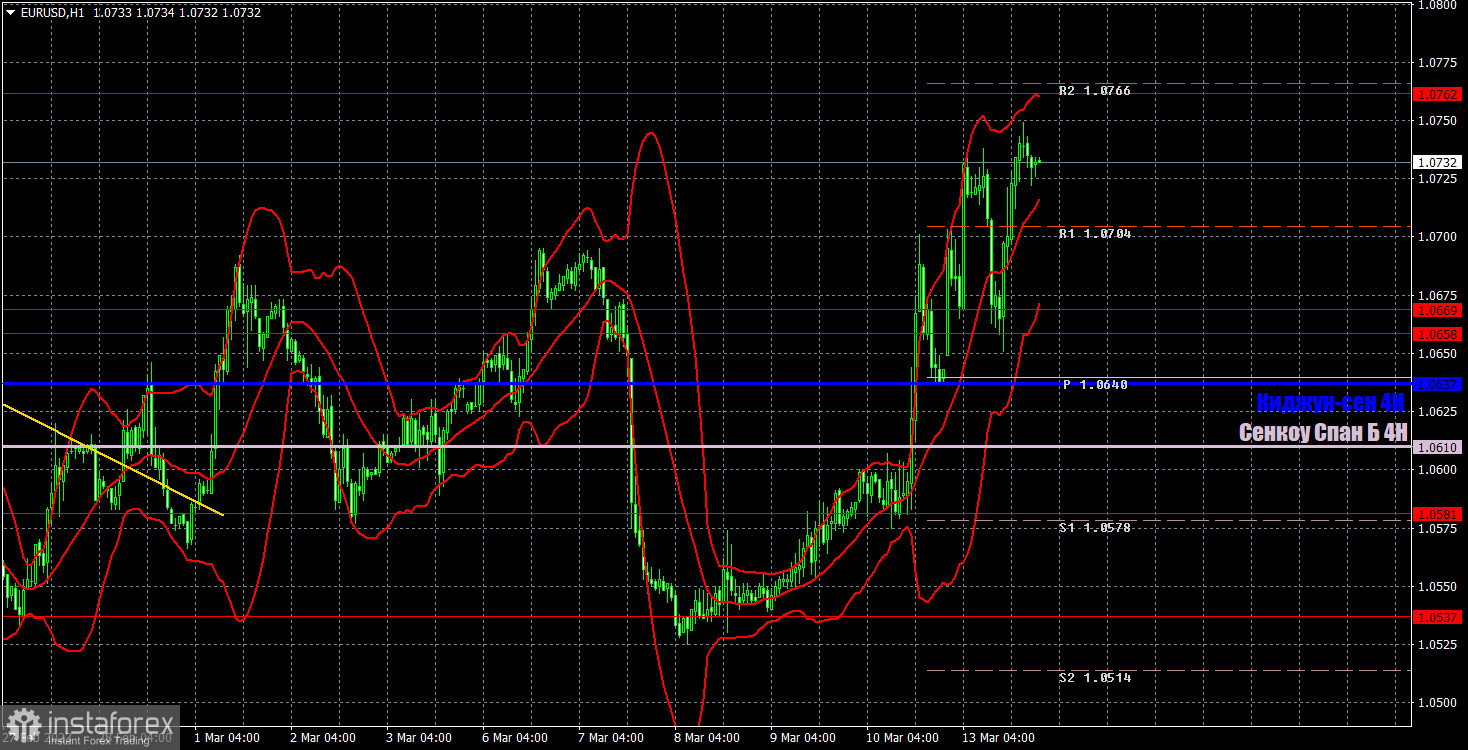
1H chart of EUR/USD
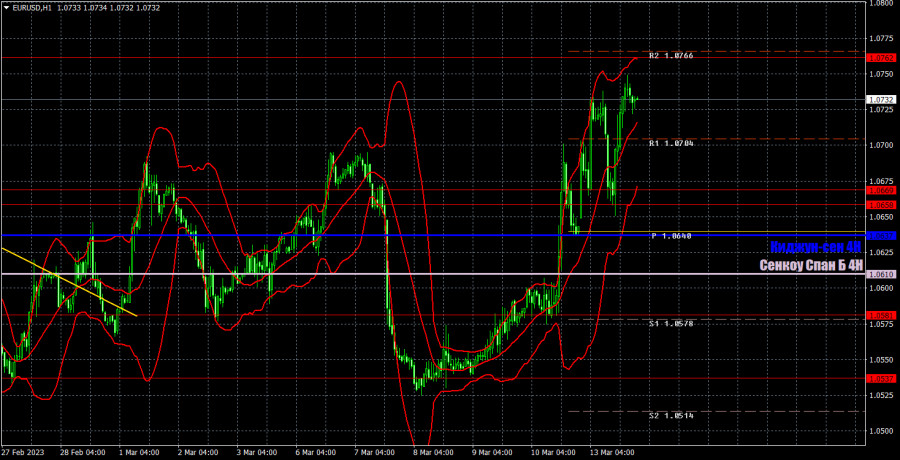
On the one-hour chart, EUR/USD surged, but in general, the entire movement still appears more like a "swing" than a trend. I am quite sure that the pair might start to sharply fall this week, since it did not have such strong reasons to grow. The market is still in an impulsive state, but sooner or later it will calm down. During that time, we should expect a resumption of more or less logical and reasonable movements. On Tuesday, important levels are seen at 1.0537, 1.0581, 1.0658-1.0669, 1.0762, 1.0806, 1.0868, 1.0938, and also Senkou Span B (1.0610) and Kijun Sen (1.0637) lines. Ichimoku indicator lines can move intraday, which should be taken into account when determining trading signals. There are also support and resistance although no signals are made near these levels. They could be made when the price either breaks or rebounds from these extreme levels. Do not forget to place Stop Loss at the breakeven point when the price goes by 15 pips in the right direction. In case of a false breakout, it could save you from possible losses. On March 14, the market will be focused on the U.S. inflation report. There are no important reports or events planned for the EU. In addition, the market may continue to be under the impression from the bankruptcy of the two U.S. banks.
Indicators on charts:
Resistance/support - thick red lines, near which the trend may stop. They do not make trading signals.
Kijun-sen and Senkou Span B are the Ichimoku indicator lines moved to the hourly timeframe from the 4-hour timeframe. They are also strong lines.
Extreme levels are thin red lines, from which the price used to bounce earlier. They can produce trading signals.
Yellow lines are trend lines, trend channels, and any other technical patterns.
Indicator 1 on the COT chart is the size of the net position of each trader category.
Indicator 2 on the COT chart is the size of the net position for the Non-commercial group of traders.